Download
1 / 18
180 likes | 294 Views
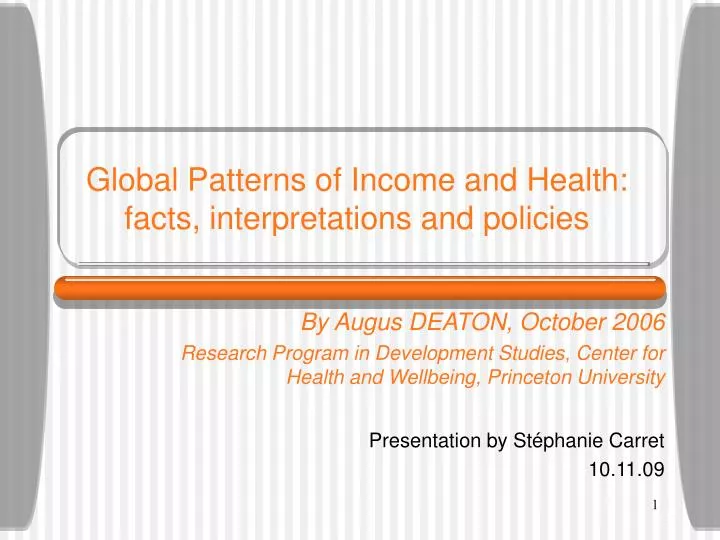
Global Patterns of Income and Health: facts, interpretations and policies. By Augus DEATON, October 2006 Research Program in Development Studies, Center for Health and Wellbeing, Princeton University Presentation by Stéphanie Carret 10.11.09. The planning for today.

E N D
Global Patterns of Income and Health: facts, interpretations and policies By Augus DEATON, October 2006 Research Program in Development Studies, Center for Health and Wellbeing, Princeton University Presentation by Stéphanie Carret 10.11.09
The planning for today • Review of the paper: main ideas • Analysis of illustrative graphs • Other views on the subject • What questions can we raise?
Dataset used • Different dataset are used, especially since it’s difficult to compare health levels at an international scale • No natural metric of health (which is not the case for income) • How to measure inequality with arbitrary chosen measures of health? • Most of the data used extends between 1960 and 2000 • Penn World Table, WDI, WHO and World Bank for China & India • What are the main health measurements used? • Life expectancy • Infant & child mortality rates (and absolute levels) • Types of widespread deadly diseases worldwide • GDP and growth rate • The Preston curve focuses on the year 2000 • Relates GDP/capita to life expectancy • The author shows that it’s essentiel to make a difference between proportionnate (ratio) and absolute (level) rate of decline of infant and child mortality
Main ideas (1) • Main indicators for inequality • Poverty; income & wealth inequality • Health inequality • In an overall, population in poorer countries have shorter life expectancy and suffer/die from more diseases than in wealthier nations • BUT exceptions: Cuba, Sri Lanka, Costa Rica… • Historically, the first noticeable global divergence in income & health levels: 18th century • This income inequality trend did not reverse • But it did for health (beginning 20th & post WWII)
Main ideas (2) • Between 1950 and 1990, convergence in international life expectancy which does not mean a link between growth rate/higher income and health levels • In poorer countries, infant & child mortality rates have decreased • In wealthier countries, mortality rates reduced for elderly people • Between 1990 and today, there has been a big break on international increase of life expectancy because of Aids/HIV • India & China, health improvements were not correlated with economical growth, or only in small increases • Income poverty and health poverty are positively correlated • Composite measure of wellbeing (income/capita X life expectancy) > separate inequalities of income or health • Other componants impact on income & life expectancy • Education, political & civil rights, democracy…
Main ideas (3) • Deaton argues that life expectancy is misleading when used in international comparison • Different patterns of mortality & mortality reduction (children vs elderly mortality) • How to compare different progress in saving lives? • Inequality reduction in life expectancy does not mean reduced health inequality • Decrease of mortality in wealthier countries increased inequality • Data poorly measured (sub-saharian Africa) • Lack of vital registration in many countries • Income growth improves population health? • Direct effect: poverty reduction • Indirect effect: health poverty reduction
Main ideas (4) • Different papers, different variables explaining mortality • Poverty & lack of income (Preston) • Wagstaff shows the link between high child mortality with lower expenditure/capita • Moser, Leon & Gwatkin show the same but linked to durable good ownership (wealth measurement) • Nutritional Engel Curve • « Wealthier is healthier » by Pritchett & Summers show undoubtedly a strong link between income/capita & child mortality • Also no evidence of good effects of government spending on health • Vulnerability of poor countries facing many diseases • As a conclusion, it seems that economic growth heals deprivation in health but it’s far from being the only factor • Education, especially for women • Institutionnal factor: health services and healthcare • Reduction in child malnutrition • Lowering fertility rates
Standard deviations of measures of health & income, 1960 to 2004
Proportionnal changes: Infant mortality & per capita economic growth
Another view: paper analysis • « The effect of health on economic growth: a production function approach », by D.Bloom, D.Canning, J.Sevilla, in Harvard School of Public Health, 2004 • Data used: 1960-1990, output in GDP, panel of countries • Use of a P° function model of aggregate economic growth, with 2 microeconomics variables of human capital: work experience and health • Labor quality is essentiel to economic growth • In the function: output is a function of its inputs and their linked efficiency (TFP) • Physical capital, Labor and human capital with 3 dimensions: education, experience and health • Growth can be decomposed in 2 sources: level of inputs and growth in TFP • Life expectancy effect on growth appears to be a real labor productivity effect • 1 year improvment in life expectancy contributes to an increase of 4% in output • Probably effect on life cycle savings & capital accumulation • Growth rates & effeciency of inputs also influence output level
Questions to be asked • According to you, what would be the best health measurement? What factors would you chose to put in this measurement? • Do you think the poor countries would perform any better regarding the Aid/HIV disease if pharmaceuticals lobbies allowed treatment generics? • How income influences health and how health impacts income & growth? • Are poor countries poor because of their poor health? • Historically no significant increase in growth comparing to the huge improvement in health in wealthier counties
Questions? Thank you.