Download
1 / 33
330 likes | 473 Views
IAEE International Conference, Stockholm, 22.06.2011. Modeling a Carbon Capture, Transport and Storage (CCTS) Infrastructure for the Industrial Sector. Technische Universität Berlin Fachgebiet W irtschafts- und I nfrastruktur P olitik.

E N D
IAEE International Conference, Stockholm, 22.06.2011 Modeling a Carbon Capture, Transport and Storage (CCTS) Infrastructure for the Industrial Sector Technische Universität Berlin Fachgebiet Wirtschafts- und Infrastruktur Politik Pao-Yu Oei (pyo@wip.tu-berlin.de)Andreas Tissen (ati@wip.tu-berlin.de)Johannes Herold (jh@wip.tu-berlin.de)
Agenda Motivation Description of the Model CCTSMOD Implemented Data Scenario Runs BAU Industry Offshore Storage Conclusion and Further Research
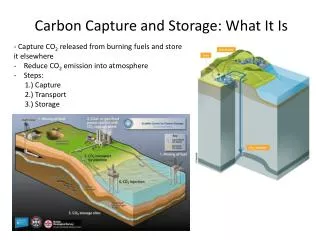
Motivation Carbon Capture Transport and Storage – CCTS 70 % higher costs without CCTS (IEA, 2009) few running projects (esp. Industry) Industry Sector Unavoidable CO2 emissions Solution for total decarbonization Higher CO2 concentration Motivation CCTSMOD Data Scenarios Conclusion Source: Clean Technica
Motivation CCTSMOD Data Scenarios Conclusion CO2 Emissions from Heavy Industry Sources CO2 Emissions Germany: 837 Mt Transport: 152 Mt Households: 128 Mt Industry: 120 Mt Energy: 348 Mt Commerce: 89 Mt EPRTR, 2010 Iron & Steel: 41 Mt Cement: 26 Mt Industry: 94 Mt Refineries: 27 Mt CO2-free alternatives Pulp & Paper: 1 Mt CO2-free alternatives H2 & NH3: 6 Mt CO2-free alternatives Petrochemical: 19
Decision Tree of the CCTSMOD Omniscient planner designs cost-optimal CCTS infrastructure given costs for infrastructure and CO2 Certificates CO2 Certificate price as initiator for CCTS development Time horizon 2010-2050 Solved as an MIP with the CPLEX Solver in GAMS Motivation CCTSMOD Data Scenarios Conclusion Source: Own illustration
Model: Cost Minimization Problem Subject to: Amount of produced CO2 for every emitter Capacity constraint for each step of the CCTS chain Physical balance for infrastructure Motivation CCTSMOD Data Scenarios Conclusion
Motivation CCTSMOD Data Scenarios Conclusion Mathematical Problem: Constraints Balance: CO2 – Balance: Capture: Flow: Storage: Planning: Total Storage: Non – Negativity:
Data: Sources and Sinks in Germany Motivation CCTSMOD Data Scenarios Conclusion Source: Ownillustriation
Motivation CCTSMOD Data Scenarios Conclusion Data: Capturing Costs Source: Owncalculationsbased on Tzimas (2009) and WI (2008)
Uncertainties influencing deployment of CCTS Available storage potential Low resolution data Different estimation methods Development of the CO2 Certificate price CO2 Certificate price is driving force Price is volatile to future climate policies Accessibility of storage sites Growing public resistance Offshore storage involves less stakeholders Motivation CCTSMOD Data Scenarios Conclusion
Selected Scenarios Motivation CCTSMOD Data Scenarios Conclusion
Scenario Results: BAU (Business as Usual) Motivation CCTSMOD Data Scenarios Conclusion in 2050 in 2025 • Industrystartsat 40 €/t • Coalstartsat 55 €/t • 2050: 80% captured (220Mt/a) • pipelinenetworkof 3800 km • mostlyonshoresinks • 38 billion € Infrastructure costs • 1.5 of 6.6 Gtstorageleft Source: Ownillustriation
BAU: Costs for avoiding CO2 emissions Motivation CCTSMOD Data Scenarios Conclusion Industry Power Plants Source: Ownillustriation
Scenario Results: Offshore only Motivation CCTSMOD Data Scenarios Conclusion in 2050 • usageof all sinks • 10 yeardelayedstart • onlyIndustrystartsat 50€/t • 2050: 20% captured: 54 Mt/a, (57% ofindustrialemission) • Pipeline networkof 2200 km Source: Ownillustriation
Scenarios Results: Overview Motivation CCTSMOD Data Scenarios Conclusion
Conclusions I: Model Outcomes Industry first-mover, at CO2 prices of 50€/t in 2050 Energy sector needs prices above 75€/t in 2050 Up to 80% reduction possible for reasonable prices Not enough affordable storage capacities for all German emitters, especially if only offshore storage possible CCTS especially for North Germany interesting Formation of regional clusters Interconnected pipeline network in the case of Offshore storage Motivation CCTSMOD Data Scenarios Conclusion
Conclusions II: General Outcomes High abatement potential for industrial emissions (first mover) higher Network-Efficiency CCTS solution for unavoidable industrial CO2 emissions Combined usage of industrial and electrical sector leads to storage scarcity (esp. in offshore case) Transport does matters (5% – 7% of all costs onshore, 17% offshore), however only if the network is planned in an optimal way). Europe-wide infrastructure planning Motivation CCTSMOD Data Scenarios Conclusion
Further Research We are currently working on: • Application of stochastic optimization • Upscaling on European Level • Integration of EOR Thankyouverymuchforyourattention! Are thereanyquestions?
References GeoCapacity (2009): Assessing European Capacity for Geological Storage of Carbon Dioxide – The EU GeoCapacity Project. Energy Procedia, Volume 1, Issue 1, February 2009, Pages 2663-2670. IEA (2009): Technology Roadmap – Carbon Capture and Storage. OECD, Paris, France: International Energy Agency. Kobos et al (2007): The 'String of Pearls': The Integrated Assessment Cost and Source-Sink Model [Conference] // 6th Annual Carbon Capture & Sequestration Conference, May 7-10 2007. - Pittsburgh, USA : Sandia National Laboratories. Mendelevitch, R., Oei, P.Y., Tissen, A. and Herold, J. (2010): CO2- Highways – Modeling Aspects of a Future CO2 Transport Infrastructure, Centre for European Policy Studies (CEPS), Working Document No. 340; Brussels, Belgium. Middleton R. and Bielicki J.(2009): A Comprehensive Carbon Capture and Storage Infrastructure Model [Conference] // Proceedings of the 9th International Conference on Greenhouse Gas Technologies. Oei, P.Y., Mendelevitch, R. Herold, J., Tissen, A. von Hirschhausen, C. (2010): CO2-Autobahnen für Europa? Energiewirtschaftliche Tagesfragen (ET Magazin), Ausgabe 12/2010, ETV Energieverlag GmbH, Essen. RECCS+ (2010): RECCS plus – Regenerative Energien (RE) im Vergleich mit CO2-Abtrennung und Ablagerung (CCS) – Update und Erweiterung der RECCS-Studie. Bundesministerium für Umwelt, Naturschutz und Reaktorsicherheit (BMU). Tzimas E. (2009): The Cost of Carbon Capture and Storage Demonstration Projects in Europe, European Commission, Joint Research Center, Institute of Energy.
Capture Costs in Industry Investment costs (based on Ho et al., 2010): 195 €/tCO2 for iron and steel 225 €/tCO2 for cement 325 €/tCO2 for petrochemical Variable costs (based on Ho et al., 2010): 17 €/tCO2 for iron and steel (60% HC) 24 €/tCO2 for cement (85% HC) 33 €/tCO2 for petrochemical (115% HC) Pipeline investment costs: Onshore: 800.000 €/km, Offshore: 960.000 €/km for a diameter of 18`` (Alstom, 2011) From 150.000 €/km to 1.200.000 €/km, depending on diameter (Metz et al., 2005)
[1]Solch optimistische Einspeiseraten wie von der IEA angenommen treffen nur auf sehr wenige Speicherorte zu. Die durchschnittliche für Europa zu erwartende Injektionsrate liegt bei ungefähr 0,33 Millionen Tonnen pro Jahr. (vgl. Gerling, 2010) In Anlehnung an diese Aussage wird für das CCTSMOD mit einer dreimal geringeren als von der IEA (2005) angegebenen Einspeiserate gerechnet. Capture Costs in Industry Storage investment costs (IEA, 2005): 12.5 – 16.9 M€/MtCO2 onshore 34.5 – 44 M€/MtCO2 offshore
Scenario Results: Industry only (on- & offshore) Motivation CCTSMOD Data Scenarios Conclusion Source: Ownillustriation
Costs for avoiding Industrial CO2 emissions Motivation CCTSMOD Data Scenarios Conclusion Source: Ownillustriation
BAU: Costs for avoiding CO2 emissions Motivation CCTSMOD Data Scenarios Conclusion Source: Ownillustriation
Data: Costs for Reference and CCTS Power Plant Source: Tzimas (2009), andÖko Institut (2011)
Mathematical Problem: Constraints Subjectto:
Data: CO2 Sources and Potential Storage Sites Point sources are often agglomerated Large point sources are mainly power plants Main storage potential in Northern Germany and North Sea Region Potential storage sites and CO2 sources are spatially divided in most cases Motivation CCTSMOD Data Scenarios Conclusion Source: Own illustration according to data from EEA and GeoCapacity
BAU for Europe in the year 2050 • CCTS only an option for countries with a regional proximity between CO2 intensive regions and storage sites. • Domination of point to point connections – no interconnected transnational network • Industry is first mover Source: Own illustration based on model results
Off 120 for Europe in the year 2050 • Interconnected European CCTS infrastructure. • Central and Eastern Europe is not connected to the network • Immense infrastructure investments only lucrative for integration of CO2 capture from power generation. Source: Own illustration based on model results