Download
1 / 44
440 likes | 573 Views
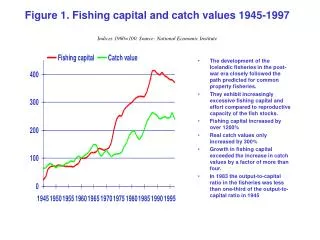
Towards quantifying the structure of the pelagic food web of Northumberland Strait. Allan J. Debertin, J.Mark Hanson and Simon C. Courtenay. SOUTHERN GULF OF ST. LAWRENCE COALITION SUSTAINABILITY. What is an Ecosystem?. Northumberland Strait. Improving Risk-Assessment.

E N D
Towards quantifying the structure of the pelagic food web of Northumberland Strait Allan J. Debertin, J.Mark Hanson and Simon C. Courtenay SOUTHERN GULF OF ST. LAWRENCE COALITION SUSTAINABILITY
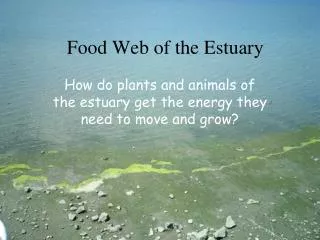
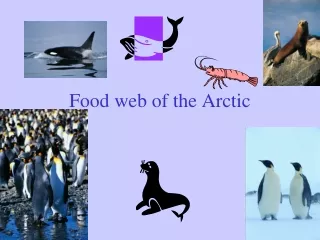
What is an Ecosystem? Northumberland Strait
Improving Risk-Assessment DFO is moving toward Ecosystem-based-management practices: EBM requires complex models that focus on multi-species interactions and environmental influences with an overall goal of a sustainable marine ecosystem. Improved risk-assessment to manage commercial stocks* Improved understanding of ecosystem functions =
Structure of research for EBM • Ecosystem Research Initiatives (ERIs) in areas of concern: • 1) Fish Population and Community Productivity • 2) Habitat and Population Linkages, • 3) Climate Change / Variability • 4) Ecosystem Assessment and Management Strategies http://www.dfo-mpo.gc.ca/science/Publications/fiveyear-plan-quinquennal/index-eng.html
Why is Northumberland Strait important? • Northumberland Strait is a dynamic productive ecosystem • Lobster is the most valuable fishery in the area. • Other fisheries include: scallop, herring, rock crab, American plaice, mackerel, tuna, cod, winter flounder, white hake, alewife, silversides, smelt, oyster, mussel, quahog, soft shell clam, and Irish moss. • Aquaculture of mussels and oysters • Tourism and recreational destination – warm summer beaches, boating and sports fishing.
Concerns raised by public and industry in Northumberland Strait • Declines in commercial fisheries • Invasive Species: Green Crab, species of algae and tunicates. • Destruction of environment – Scallop dredgers and construction of Confederation Bridge. • Deteriorating water quality – sediment deposition, eutrophication, construction of cottages and water barriers. • Changes in Climate
? Before we can begin to understand how human activities impact ecosystem components, we need to first understand how ecosystems function. ? ? ? ? ? ? ? ? ? ? ?
Predator – Planktivorous Fish Atlantic herring - Clupea harengus Alewife - Alosa pseudoharengus Mackerel - Scomber scombrus Sandlance - Ammodytes americanus Rainbow smelt - Osmerus mordax
Objectives • Oceanographic conditions of the Northumberland Strait. – Driving forces of production • Distributions of planktivorous fish species and zooplankton. Determine where distinct spatial assemblages occur and if they are explained by environment. • Describe the diet composition of planktivorous fish.
Sampling Data collected in July-August aboard CCGS Opilio (18.2m). Survey since 2000-2009 11
Zooplankton Collection Flow Meter 19
Environmental Measurements CTD Probe Temperature Salinity Density Chl. A Fluor. Turbidity PAR O2Conc. 20
Data Collected Data Set Type Year Fish Distribution – Biomass and Abundance 2000-09 Fish Length Frequencies – Abundance 2005-09 Zooplankton Distribution – Abundance + Biomass 2007-09 CTD - Environmental Factors 2008-09 Diet Analysis of Fish Stomachs2008-09
Objectives • Oceanographic conditions of the Northumberland Strait. – Driving forces of production • Distributions of planktivorous fish species and zooplankton. Determine where distinct spatial assemblages occur and if they are explained by environment. • Describe the diet composition of planktivorous fish.
Depth (m) Oceanographic Conditions
Temperature (oC) Oceanographic Conditions Bottom-water Summer: July-August Surface-water
Chlorophyll a Fluorescence Dissolved Oxygen Turbidity Salinity PAR Density
Oceanographic Conditions Chlorophyll a Fluorescence [mg/l]
Objectives • Oceanographic conditions of the Northumberland Strait. – Driving forces of production • Distributions of planktivorous fish species and zooplankton. Determine where distinct spatial assemblages occur and if they are explained by environment. • Describe the diet composition of planktivorous fish.
Zooplankton Biomass [g/m3] Biota Distributions
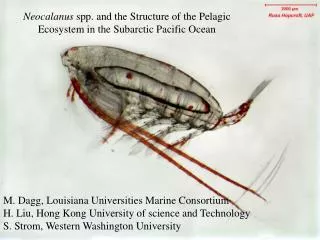
# individuals/m3 2008 Large-sized copepods Calanus spp. 2009
# individuals/ha Adult Herring (>22cm) 2008 2009
# individuals/m3 # individuals/m3 Podon sp. Crab Zoea Echinoderm Larvae Axius-like Evadne sp. Pteropods
# individuals/m3 # individuals/m3 Podon sp. Crab Zoea Echinoderm Larva Stage I Axius-like Evadne sp. Pteropods
Patterns in zooplankton composition Multivariate Data analysis – via PRIMER v 6.0 CLUSTER routine. Species assemblages = groups of animals that co-occur in similar patterns which may be influenced by environmental or biotic variables -Determines where most significant change occur in species composition - SIMPROF 33
6 5 9 8 7 4 3 2
Zooplankton Assemblages Assemblage Group
BEST Routine on Primer rw = weighted Spearman rank correlation coefficient 0 = no correlation 1,-1 = complete correlation Variables used: 1 – B. Temperature 2 – B. Salinity 3 – B. Density 4 – S. Temperature 5 – S. Salinity 6 – S. Density 7 - Max Chl. A Fluor.
BEST Routine on Primer rw = weighted Spearman rank correlation coefficient 0 = no correlation 1,-1 = complete correlation
BEST Routine on Primer rw = weighted Spearman rank correlation coefficient 0 = no correlation 1,-1 = complete correlation
Gaspereau Rainbow Smelt A.Sandlance Mackerel
7 4 6 5 2 3 1
Assemblage group Fish Assemblages
Discussion • Oceanographic conditions in the Strait are complex. There is three dimensional structuring of the Strait, providing different aquatic habitat at small spatial scale. • Phytoplankton occurs in highest levels in west and east. • Distinct zooplankton and fish communities exist, and there is close spatial association between them. • Zonation of biota could provide a means for fisheries managers to determine how detrimental disturbance will influence particular communities of zooplankton and fish.
Discussion • Diet Analysis of Fish – Will provide primary estimate of consumption towards mass-balanced modelling of NS. • Other Communities need to be quantified – I.E. Benthic invertebrates in Northumberland Strait. • Other Seasons – How does the Ecosystem function in Fall, spring, winter? • Need to continue to monitor Northumberland Strait for future changes.
Acknowledgements SOUTHERN GULF OF ST. LAWRENCE COALITION SUSTAINABILITY This study would not be possible without the efforts of the captains and crew of the CCGS Opilio, supporting survey staff, and hired students.