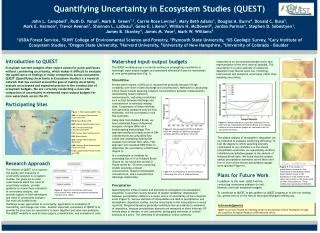
Download

1 / 41
410 likes | 599 Views
Towards quantifying the uncertainty in carbon fluxes. Tony O’Hagan University of Sheffield. Outline. The carbon flux problem Quantifying input uncertainties Propagating uncertainty Results. Computer models.

E N D
Towards quantifying the uncertainty in carbon fluxes Tony O’Hagan University of Sheffield RSS Oxford
Outline • The carbon flux problem • Quantifying input uncertainties • Propagating uncertainty • Results RSS Oxford
Computer models • In almost all fields of science, technology, industry and policy making, people use mechanistic models to describe complex real-world processes • For understanding, prediction, control • There is a growing realisation of the importance of uncertainty in model predictions • Can we trust them? • Without any quantification of output uncertainty, it’s easy to dismiss them RSS Oxford
Examples • Climate prediction • Molecular dynamics • Nuclear waste disposal • Oil fields • Engineering design • Hydrology RSS Oxford
Carbon flux • Vegetation can be a major factor in mitigating the increase of CO2 in the atmosphere • And hence reducing the greenhouse effect • Through photosynthesis, plants take atmospheric CO2 • Carbon builds new plant material and O2 is released • But some CO2 is released again • Respiration, death and decay • The net reduction of CO2 is called Net Biosphere Production (NBP) • I will refer to it as the carbon flux • Complex processes modelled in SDGVM • Sheffield Global Dynamic Vegetation Model RSS Oxford
CTCD • The Centre for Terrestrial Carbon Dynamics was a NERC Centre of Excellence • Now part of National Centre for Earth Observation • One major exercise was to estimate the carbon flux from vegetation in England and Wales in 2000 • SDGVM run at each of 707 sites over England & Wales • 4 plant functional types (PFTs) • Principal output is NBP • Many inputs RSS Oxford
SDGVM C flux outputs for 2000 • Map of SDGVM estimatesshows positive flux (C sink)in North, but negative(C source) in Midlands • Total estimated flux is9.06 Mt C • Highly dependent onweather, so will varygreatly between years RSS Oxford
Accounting for uncertainty • There are several sources of uncertainty • Uncertain inputs • PFT parameters, defining plant growth etc • Soil structure • Land cover types • Weather • Model structure • All models are wrong! • Two main challenges • Formally quantifying these uncertainties • Propagating input uncertainty through the model RSS Oxford
Progress to date • A paper dealing with uncertainty in plant functional inputs and soil inputs • Kennedy, O'Hagan, Anderson et al (2008). Quantifying uncertainty in the biospheric carbon flux for England and Wales. J. Royal Statistical Society A171, 109--135. • A paper showing how to quantify uncertainty in land cover • Cripps, O'Hagan, Quaife and Anderson (2008). Modelling uncertainty in satellite derived land cover maps. http://tonyohagan.co.uk/academic/pub.html • Recent work combines these • Still need to account for uncertainty in weather and model structure RSS Oxford
Quantifying input uncertainties • Plant functional type parameters • Expert elicitation • Soil composition • Simple analysis from extensive data • Land cover • More complex analysis of ‘confusion matrix’ data RSS Oxford
Elicitation • Beliefs of expert (developer of SDGVMd) regarding plausible values of PFT parameters • Four PFTs – Deciduous broadleaf (DBL), evergreen needleleaf (ENL), crops, grass • Many parameters for each PFT • Key ones identified by preliminary sensitivity analysis • Important to allow for uncertainty about mix of species in a site and role of parameter in the model • In the case of leaf life span for ENL, this was more complex RSS Oxford
ENL leaf life span RSS Oxford
Correlations • PFT parameter value at one site may differ from its value in another • Because of variation in species mix • Common uncertainty about average over all species induces correlation • Elicit beliefs about average over whole UK • ENL joint distributions are mixtures of 25 components, with correlation both between and within years RSS Oxford
Soil composition • Percentages of sand, clay and silt, plus bulk density • Soil map available at high resolution • Multiple values in each SDGVM site • Used to form average (central estimate) • And to assess uncertainty (variance) • Augmented to allow for uncertainty in original data (expert judgement) • Assumed independent between sites RSS Oxford
Land cover map • LCM2000 is another high resolution map • Obtained from satellite images • Vegetation in each pixel assigned to one of 26 classes • Aggregated to give proportions of each PFT at each site • But data are uncertain • Field data are available at a sample of pixels • Countryside Survey 2000 • Table of CS2000 class versus LCM2000 class is called the confusion matrix RSS Oxford
CS2000 versus LCM2000 matrix • Not symmetric • Rather small numbers • Bare is not a PFT and produces zero NBP RSS Oxford
Modelling land cover • The matrix tells us about the probability distribution of LCM2000 class given the true (CS2000) class • Subject to sampling errors • But we need the probability distribution of true PFT given observed PFT • Posterior probabilities as opposed to likelihoods • We need a prior distribution for land cover • We used observations in a neighbourhood • Implicitly assuming an underlying smooth random field • And the confusion matrix says nothing about spatial correlation of LCM2000 errors • We again relied on expert judgement • Using a notional equivalent number of independent pixels per site RSS Oxford
Overall proportions • Red lines show LCM2000 proportions • Clear overall biases • Analysis gives estimates for all PFTs in each SDGVM site • With variances and correlations RSS Oxford
Propagating uncertainty • Uncertainty analysis • Problems with simple Monte Carlo approach • Emulation • Gaussian process emulation • The MUCM project RSS Oxford
Uncertainty analysis • We have a computer model that produces output y = f(x) when given input x • But for a particular application we do not know x precisely • So X is a random variable, and so therefore is Y = f(X) • We are interested in the uncertainty distribution of Y • How can we compute it? RSS Oxford
Monte Carlo • The usual approach is Monte Carlo • Sample values of x from its distribution • Run the model for all these values to produce sample values yi = f (xi) • These are a sample from the uncertainty distribution of Y • Typically requires thousands of samples of input parameters • And in this case we would need to run SDGVM 4x707 times for each sample! • Neat but impractical if it takes minutes or hours to run the model RSS Oxford
Emulation • A computer model encodes a function, that takes inputs and produces outputs • An emulator is a statistical approximation of that function • Estimates what outputs would be obtained from given inputs • With statistical measure of estimation error • Given enough training data, estimation error variance can be made small RSS Oxford
So what? • A good emulator • estimates the model output accurately • with small uncertainty • and runs “instantly” • So we can do uncertainty analysis etc fast and efficiently • Conceptually, we • use model runs to learn about the function • then derive any desired properties of the model RSS Oxford
GP solution • Treat f(.) as an unknown function with Gaussian process (GP) prior distribution • Use available runs as observations without error, to derive posterior distribution (also GP) • Make inference about the uncertainty distribution • E.g. The mean of Y is the integral of f(x) with respect to the distribution of X • Its posterior distribution is normal conditional on GP parameters RSS Oxford
Why GP emulation? • Simple regression models can be thought of as emulators • But error estimates are invalid • We use Gaussian process emulation • Nonparametric, so can fit any function • Error measures can be validated • Analytically tractable, so can often do uncertainty analysis etc analytically • Highly efficient when many inputs • Reproduces training data correctly RSS Oxford
2 code runs • Consider one input and one output • Emulator estimate interpolates data • Emulator uncertainty grows between data points RSS Oxford
3 code runs • Adding another point changes estimate and reduces uncertainty RSS Oxford
5 code runs • And so on RSS Oxford
BACCO • This has led to a wide ranging body of tools for inference about all kinds of uncertainties in computer models • All based on building the GP emulator of the model from a set of training runs • This area is now known as BACCO • Bayesian Analysis of Computer Code Output RSS Oxford
BACCO includes • Uncertainty analysis • Sensitivity analysis • Calibration • Data assimilation • Model validation • Optimisation • Etc… • All within a single coherent framework RSS Oxford
MUCM • Managing Uncertainty in Complex Models • Large 4-year research grant • Started in June 2006 • 7 postdoctoral research assistants • 4 PhD studentships • Based in Sheffield, Durham, Aston, Southampton, LSE • Objective: to develop BACCO methods into a robust technology that is widely applicable across the spectrum of modelling applications RSS Oxford
Emulation of SDGVM • We built GP emulators of all 4 PFTs at 30 of the 707 sites • Estimates (posterior means) and uncertainties (variances and covariances) inter-/extrapolated to the other sites by kriging • Uncertainty due to both emulation and kriging separately accounted for RSS Oxford
Sensitivity analysis for one site/PFT Used to identify the most important inputs. These are the ones we needed to formulate uncertainty about carefully. RSS Oxford
Results RSS Oxford
Mean NBP corrections RSS Oxford
NBP standard deviations RSS Oxford
Mean NBP Standard deviation Aggregate across 4 PFTs RSS Oxford
England & Wales aggregate RSS Oxford
Sources of uncertainty • The total variance of 0.2968 is made up as follows • Variance due to PFT and soil inputs = 0.2642 • Variance due to land cover uncertainty = 0.0105 • Variance due to interpolation/emulation = 0.0222 • Land cover uncertainty much larger for individual PFT contributions • Dominates for ENL • But overall tends to cancel out • Changes estimates • Larger mean corrections and smaller overall uncertainty RSS Oxford
Conclusions • Bayesian methods offer a powerful basis for computation of uncertainties in model predictions • Analysis of E&W aggregate NBP in 2000 • Good case study for uncertainty and sensitivity analyses • But need to take account of remaining sources of uncertainty • Involved several technical extensions • Has important implications for our understanding of C fluxes • Policy implications RSS Oxford
Finally • This was joint work with many others • Plant, soil and earth observation – Shaun Quegan, Ian Woodward, Mark Lomas, Tristan Quaife, Andreas Heinemeyer, Phil Ineson • Statistics – Marc Kennedy, John Paul Gosling, Ed Cripps, Keith Harris, Clive Anderson • Links • http://www.shef.ac.uk/ctcd • http://mucm.group.shef.ac.uk • http://tonyohagan.co.uk/academic RSS Oxford