Download
1 / 29
290 likes | 489 Views
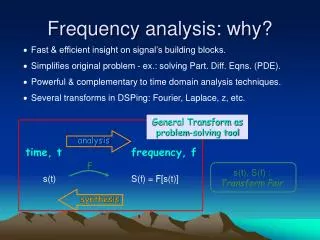
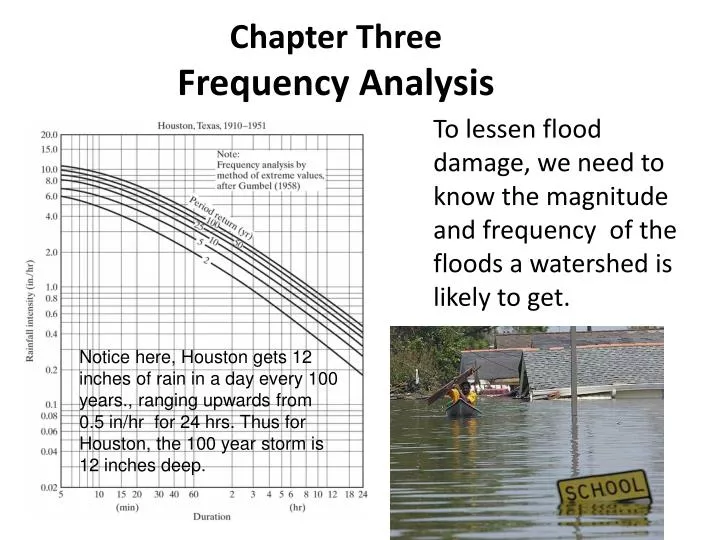
To lessen flood damage, we need to know the magnitude and frequency of the floods a watershed is likely to get. Chapter Three Frequency Analysis.

E N D
To lessen flood damage, we need to know the magnitude and frequency of the floods a watershed is likely to get. Chapter ThreeFrequency Analysis Notice here, Houston gets 12 inches of rain in a day every 100 years., ranging upwards from 0.5 in/hr for 24 hrs. Thus for Houston, the 100 year storm is 12 inches deep.
Most of the measurements we make in Hydrology (flow rate, rainfall intensity) cannot be predicted with certainty. They are Random Variables. Most are continuous, as shown by the smooth curve in the upper figure, but we generally make them discrete by averaging over a time interval. In the upper figure, the quantized average flow between hours 15 and 20 was about 3 cfs. Method of average rectangles Rainfall forecasts are given as probabilities. Note % on Precip.
The Silenz River watershed is unaltered, and the 5-year running averages (average of current year and previous 4) is similar over 75 years.
By contrast, this example shows decreased variability after a dam created a reservoir in the 60’s.
Part 1: Probability • The probability P(A) of an event A is the relative number of occurrences of event A after a very large number of trials. • It will be convenient to define the sum of the probabilities of all the possibilities as one. • Si (P(Xi) = 1 • This means that a probability can range from zero to one • 0 ≤ P ≤ 1
Independence • Two trials are independent if the probability of one outcome does not depend on any previous outcomes. • For example, in a coin toss, the probability of tails does not depend on any previous tosses.
Eight of the 52 cards satisfy the occurrence of this event Unions Mutually exclusive, cannot draw a card that is both a King and an Ace. • The probability of a Union “A OR B” (occurrence of either of two mutually exclusive events) is the sum of the probabilities of either. • For example, in the drawing of a single card from a fresh deck, the probability of drawing an Ace or a King is 4/52 + 4/52 OR
Intersections • The probability of an intersection “A AND B” (occurrence of both of two events) is the product of the probabilities of each. • For example, in the drawing of a single card from a fresh deck, the probability of drawing a face card (J,Q,K) that is red is 12/52 x 26/52 = 312/2704 = 6/52 There are 12 face cards (red or black) and 26 red cards in a 52 card deck.
Intersections 2 • The probability of throwing a five with a single die is 1/6 • The probability of repeating the five is • 1/6 x 1/6 = 1 / 36 • The probability of throwing n fives in a row is (1/6)n • In n coin tosses, the chance of getting n tails in a row is 1/2n
The T-year Flood • We talked about an event, the T-year flood. • For example, we talked about a 100-year flood in Houston • The probability of the event T is 1/T • For example, in any year, the chance of getting the 100-year flood is 1/100 • The probability that the event T does not occur is 1- 1/T
Annual Maximum Event • An annual maximum event has a return period (or “recurrence interval”) of T years if its magnitude is exceeded, on average, every T years.
Annual Exceedances • The n largest events (flood, rainfall) in n years • May have more than one event in the same year • Still assumes independent
An Example: n = 3 years For the three years each has a maximum, the largest in year 1, then year three, then year 2 But year 1 also had the second highest flow in the three years, so the three largest exceedances are 1000 and 950 (year 1) and 900 (year 3) • Year three highest flows (cfs) 1 1000 950 550 2 550 400 200 3 900 800 100 Rank A. Maxima A. Exceedances 1 1000 1000 2 900 950 3 550 900
The large peaks in excess of 2800 mm are each due to a single flood. Rain exceeded 3000 mm intervals four times, in1904, then not till1929, then 1953, then 2000 The average interval is: ( 25 + 24 + 47) / 3 = 32 year event, the 32 year flood exceeds 3000 mm. A 200-year precipitation index for the central English Lake District P. A. BARKER, R. L. WILBY & J. BORROWS Hydrological Sciences–Journal–des Sciences Hydrologiques, 49(5) October 2004 pages 769-785
Two Possible Events • Frequently we deal with situations where the are two possible events • Heads or Tails • It rains or it doesn’t • The dam is overtopped or it isn’t • Suppose the probability that it will rain today is 75%, or Prain = 3/4 • Then the probability that it WON’T rain is • Pdry = 1 – 3/4 = 1/4 or 25% since the total has to be one.
Coin Tosses • Suppose we have a fair coin, so that we expect to get nearly the same number of heads and tails if we flip the coin many times. We expect to get heads half the time, and tails half the time. We say that the probability of getting heads p=1/2, and the probability of getting tails is q =1/2 also. This is our null hypothesis, H0., which says that the coin is fair, heads and tails are equally likely.
Coin Tosses Heads or tails are the only two possibilities, i.e. we will get one or the other each coin toss. Each is equally likely; each should happen 1/2 the time. Notice 1/2 + 1/2 =1; we already agreed that it will be convenient if the sum of all probabilities adds to one. Then if the probability of one event p equals any value less than one, the probability of the other event, q , must equal (1-p).
Coin Tosses • We can do a lot of checking ideas in science by assuming that there is no difference between two things, and then check the frequencies we observe against our Null Hypothesis, H0. If our observation should be very rare, maybe we should reject H0.
Coin Tosses • If we flip a coin only four times, and we get HHHH, we shrug and say we got that by chance; heads and tails are still equally likely. Expected values were not found because of “sampling error”.
Coin Tosses • But if we get HHHHHHHHHHHHHHHHHHHHHHHT in 24 coin tosses we begin to think that our null hypothesis is wrong, i.e. that maybe there is a difference in the probability of getting a head and tail.
Binomial Distribution • We can actually calculate the chance of getting k=23 heads in n=24 coin tosses if our null hypothesis H0 is right. We feel intuitively that 23 heads and one tail will be a rare event. Is it? Call the event "heads" a success. • The probability of getting exactly k successes with prob. p in n trials is given by the binomial density:
That Binomial Coefficient • If there is only one way to do something, then the binomial coefficient is 1. • For example, suppose we want event A, the probability of a tail ONLY on the second of five coin tosses. That is, Head Tail Head Head Head • There is only one way to do that, so the probability is a pure union for 1 tail and four heads Prob(A) = 1/24 x 1/21 = 0.03125
That Binomial Coefficient • BUT, If there is more than one way to do something, then the binomial coefficient is larger than 1. • For example, suppose we want event B, the probability for 1 tail and four heads, with the tail anywhere • There are five ways to do that, put the tail in the 1st, 2nd, 3rd, 4th, or 5th positions. • Prob(B) = 1/24 x 1/21 + 1/24 x 1/21 + 1/24 x 1/21 + 1/24 x 1/21 + 1/24 x 1/21 • Prob (B) = 5 x 1/24 x 1/21 = 0.15625
That Binomial Coefficient • In complex situations, it is easier to calculate the coefficient using the formula • n ! (n-k)! k! where n is the number of trials, and k is the number of one of the two possiblities.
That Binomial Coefficient • Let’s say you have a project that will last n = 10 years and the probability of a rain that will flood your project occurs, on average, every 50 years. In any year, P(flood) = 1/50, and P(no flood in some year) = 49/50 • If floods in the first (foundation pour and cure) and the seventh year (basement electrical and HVAC install prior to waterproof enclosure) will kill your profit, there is only one possible ordering that will cause problems with your profit: • yes no nononono yes no nono, • and P(flood in 1st and 7th year) = 1 x (1/50)2 x (49/50)8 = .00034 • However if k = 2 floods in any of the n = 10 years will kill your profit, there are many ways to do this n ! = 10 ! = 10x9x8x7x6x5x4x3x2x1 • (n-k) ! = (10-2) ! = 8x7x6x5x4x3x2x1 • 2 ! = 2x1 = 2 • and “10 choose 2” = 10x9/2 (Blackboard DEMO) = 45 ways to arrange 2 floods in 10 years • P(2 floods in 10 years) = 45 x (1/50)2 x (49/50)8 = .0153
Back to our Coin Toss example1 tail in 24 tosses • I'll calculate it for you, just this once. The terms on the left side are: • n! = 24*23*22* … *1 ; k! =23*22*21* … *1 ; and n - k = 24 - 23 = 1 so (n - k)! = 1! =1 n! !=(24*23*22* … *1) = 24 k! (n - k)! (23*22*21* … *1)( 1 ) The left is (because k = 23 heads, n-k = 1 tail)
Our Coin Toss Example • p = 1/2 and 1-p is also =1/2, so the right side is 1/2 raised to the 23rd power times 1/2. • The whole thing is equal to • = 24 * (1/2)23* (1/2)1 = .00000143. In other words 23 heads and one tail will occur about once in 700,000 attempts in repeated 24 coin tosses. We can probably agree that that is too rare. Our coin probably came from a magic shop, and we should reject H0 which says that heads and tails are equally likely. The basis of Inferential Statistics.
Risk and Reliability • The probability of at least one occurrence of the T-year event in n years is called the Risk. • The prob. of an occurrence in one year p = 1/T • The Risk is the sum of probs. of one such flood, two floods, three floods, …, n floods. • Easier to calculate with 1 - P(none) = 1 – P(0) • P(0) = P(none in n years) = (1- p)n • Risk = 1 – P(0) = 1 - (1- p)n = 1 – (1 – 1/T)n • Reliability is 1-Risk = (1- p)n = (1- 1/T)n
Flood Control Design • We will use these ideas with the examples and related homework problems. Earthen cofferdam overtopped Sheet Piling cofferdam section