Download
1 / 68
690 likes | 890 Views
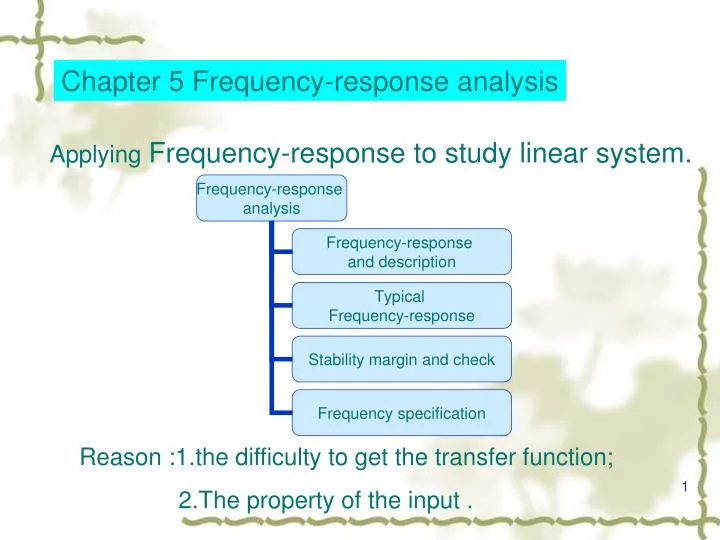
Chapter 5 Frequency-response analysis. Applying Frequency-response to study linear system. Reason :1.the difficulty to get the transfer function; 2.The property of the input. characteristics.

E N D
Chapter 5 Frequency-response analysis Applying Frequency-response to study linear system. Reason :1.the difficulty to get the transfer function; 2.The property of the input .
characteristics (1)The frequency response has clear and definite physical meaning, it can be determined by experiment method. To the system difficult to write the differential equation, it has actual meaning of importance. (2) because the frequency response analyzes system by open -loop frequency characteristic, it is direct,simple, has little calculation. (3) the frequency response not only is applicable to the linear time-invariant system, but also the system with pure delay and part non-linear system.
5.1Frequency-response and description 5.1.1Frequency-response basic concept Frequency characteristic,also called Frequency response,is the response characteristic to sine signal of a system or component. The output amplitude and phase generally differ from input, and vary with different input signal frequency .
red—input,blue—complete response,black—steady-state response 6 yss(t) amplitude 4 2 0 u(t) -2 -4 red—input,blue—complete response,black—steady-state response -6 2 y(t) -8 1.5 0 1 2 3 4 5 6 t/s yss(t) 1 amplitude 0.5 0 -0.5 -1 -1.5 y(t) u(t) -2 0 1 2 3 4 5 6 t/s
Assume system TF ,its Laplace transformation Given input A is a constant,output: (5-1) poles G(s) To a stable system (5-2)
(5-2) Coefficient to be determined (5-4) 0,when (5-5) (5-6) Owing to is a complex vector,can be expressed (5-7)
Amplitude-frequency characteristic (5-11) phase-frequency characteristic Steady-state output of a linear systemis a sine signal and its frequency is the same as input sine signal frequency. the amplitude ratio of output to input is note Phase deviationof output to input
As a case,see R-C circuit。Fig.5-3. TF is Set input (5-15) where
--------frequency characteristic of RC circuit 。 connected with construction and parameters of RC circuit, independent of the input signal。 , output/input amplitude ratio when steady state , output/input phase deviation when steady state because and Are the function of input signal frequency They are called respectively amplitude-frequency characteristic and phase-frequency characteristic。 Physical meaning:the output/input ratio,Or output/input amplitude ratio and output/input phase deviation . The relation between input and output when a sine signal with a frequency is exerted to a circuit.
Circuit output/input amplitude ratio (a) amplitude-frequency characteristic
Circuit output/input phase deviation (b) phase-frequency characteristic。
compare phase-frequency characteristic and TF is of very similar form.。
5.1.2 expressed forms (1)Bode diagram or logarithmic plot (2)Polar plot (3)Log-magnitude versus phase plot Logarithmic amplitude-frequency characteristic logarithmic frequency characteristic Logarithmic phase-frequency characteristic () The longitudinal coordinate is marked according to linearity Horizontal coordinateis marked according to
Polar plot,also amplitude-phase frequency characteristic . Can be expressed by a vector with amplitude and phase , Amplitude and phase of When input signal frequency the vector G(jw) vary,the curve which its end point traces in complex plane is called polar diagram---- Nyquist curve----- Nyquist diag. Nyquist analysed feedback control system stability in 1932.
5.2typical component bode diag. 5.2.1 proportion K Please look at the following page
5.2.2 integer and differential Difference :sign Inference These amplitudes-frequency curve pass the point
Diag. 5-9 The log-frequency characteristic of the differential
-20dB/dec -40dB/dec -60dB/dec log-frequency characteristic Diag. 5-10
5.2.3 first-order first-order Low frequency,log-amplitude frequency characteristic is a 0 decibel line phase-frequency characteristic Low frequency, high frequency, high frequency,log-amplitude frequency is a line whose slope is -20db/dec Diag.5-10 gives the asymptote and the accurate curve of first order system. Please look at following page
Asymptote Corner frequency Asymptote Exact curve Exact curve Diag.5-11 log-frequency characteristic of the 1 order system
Diag.5-12 log amplitude error between Asymptote andExact curve
Diag. 5-13 log-frequency characteristic of the 1 order factor
Low frequency asymptote Low frequency, -20log1=0dB High frequency, A line whose slope is -40db/dec because ,cross point low frequency and High frequency appears at
Resonant frequency and Resonant peak (5-22) set (5-23) Resonant frequency (5-25) Resonant peak when ,no peak ,no resonance. Is as following page. relation between and
/dB Fig.5-15 relation between and