Download
1 / 27
270 likes | 369 Views
Market Update for a Buyers Market. Montgomery County . What’s happening in the market Progress in marketing your home A plan for moving forward. Agenda. What Today’s Buyers Are Thinking. Insert local buyer behavior and attitudes here: XX XX XX XX.

E N D
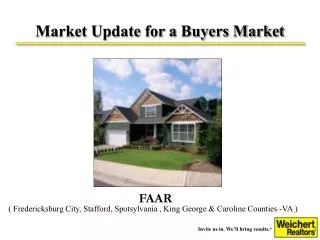
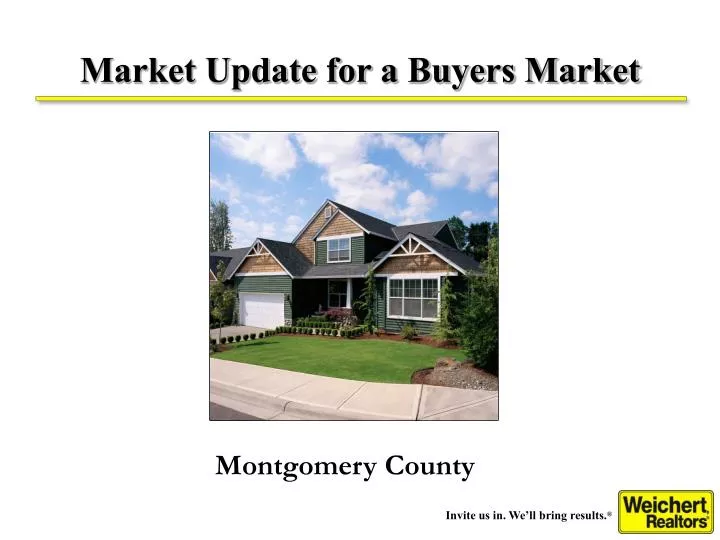
Market Update for a Buyers Market Montgomery County
What’s happening in the market Progress in marketing your home A plan for moving forward Agenda
What Today’s Buyers Are Thinking Insert local buyer behavior and attitudes here: XX XX XX XX
Houses priced properly for this market are selling. Insert local market trends here: XX XX XX What’s Happening in the Market
Sample Market Absorption Rate Anytown, USA 5.1 months of supply (absorption rate) 117 current active listings = 23 reported sales in last 30 days The absorption rate, also known as months of supply, is the number of months projected to deplete the existing inventory of homes based on current monthly sales, assuming no new homes will come on the market. In the example above, it would take slightly more than 5 months to sell the existing inventory of homes.
Market Absorption Scale(Absorption Rate in Months) 5-6 months absorption rate indicates a normal market.
Listings from the MLS in Weichert Market Areas In our local area (DC, MD, and VA), the number of homes for sale (Weichert and non-Weichert listings) has steadily increased over the past two years.
Housing Statistics Capital Region Montgomery County
Active Listings Montgomery County +23% Compared to 4/13
New Pending Montgomery County -2% Compared to 4/13
Absorption Rate Montgomery County 2MONTH SUPPLY
List vs. Sold Price Montgomery County 99% List to Sold Price 98% List to Sold Price
Number Homes Sold Montgomery County -12% Compared to 4/13
1 2 3 4 5 6 7 8 9 10 11 12 Normal Market Absorption in Months Market Scale for Supply & Demand High Supply/Low Demand Low Supply/High Demand Normal Weichert has been studying market conditions for more than 3 decades and has found a direct correlation between market absorption and property values. As absorption rates increase beyond a normal market level of 5-6 months, property values depreciate annually. Note: This Market Scale is valid only for absorption rates between 1 and 12 months.
Price to hit the market not chase it Your Listing Your Listing Market Market Market
Price Trend Analysis The Price Trend Analysis is Weichert’s tool for summarizing market trends It includes a pricing and inventory analysis to determine a price range and time frame for selling a home The price range is based on homes that have sold in the past, in the recent past, those that are currently under contract and houses currently on the market
Price Trend Analysis For the following two slides, choose the version of the PTA you will be using and delete the other slide.
Let’s look at your competition Properties currently in competition with yours for buyer attention. Properties that have caught buyer attention in the last 30 days. At this rate, how many months will it take for the current buyer demand to absorb the current listing supply in this sector of the market?
Competitively Priced Homes are Selling • Effects of Over Pricing: • Buyer excitement diminishes quickly • Extends time house is on the market • Results in price reductions • May attract “bargain hunters” and discounted offers • Effects of Right Pricing: • Promotes a sense of urgency among buyers • Generates interest and showings • Controls negotiations • Results in highest price in shortest time
How would you like your home to be positioned in the market?
Progress in Marketing Your Home Broker open house Public open houses Agent showings Internet activity Agent feedback Buyer feedback
Progress in Marketing Your Home Broker open house Public open houses Agent showings Internet activity Agent feedback Buyer feedback Bottom line . . . Our experience is that an average of 30 showings on a property, usually brings an offer.
A Plan for Moving Forward The market is telling us, by the absence of offers, to generate fresh interest by repositioning your home This will bring a whole new group of buyers Your home will stand out among all other properties
Your Home vs. the Home You’ll Purchase If the home you’re purchasing when you’re moving up has adjusted the same percentage of its value as the home you’re selling, your move is now more affordable. (To move up from a $300,000 home to a $500,000 home takes an additional $200,000. If each home has a 10% adjustment of its value, only $180,000 additional is needed – a savings of $20,000.)