Download
1 / 20
200 likes | 324 Views
Figure S1. A. *. *. *. B. *. *. *. *. *. *. *. *. *. *. Figure S2. A. Fold Increase. OxPhos Genes. B. Figure S3. A. ECAR ( mpH /min) or OCR ( pmol /min). C. SEL-Resistant. SEL-Sensitive. Relative Luciferase Activity (ATP). B. SEL-Sensitive. SEL-Resistant.

E N D
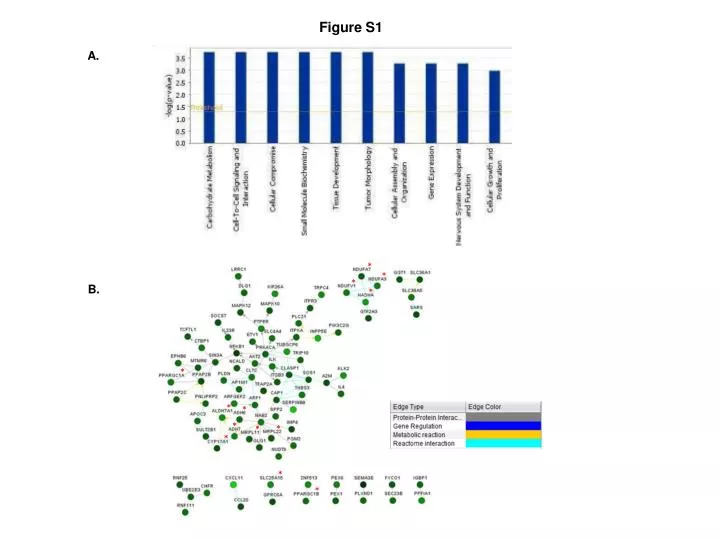
Figure S1 A. * * * B. * * * * * * * * * *
Figure S2 A. Fold Increase OxPhos Genes B.
Figure S3 A. ECAR (mpH/min) or OCR (pmol/min) C. SEL-Resistant SEL-Sensitive Relative Luciferase Activity (ATP) B. SEL-Sensitive SEL-Resistant Concentration (mmol/L) SEL-Sensitive SEL-Resistant
Figure S4 CI >1.0 CI <1.0 P < 0.0001
Figure S5 A. Dead Cells (%) B. C. PGC1α [Treatment : Mock] OCR (pmoles/min)
Figure S6 Tumor Suppression mTOR1/2 Activity A. 1 2 Proliferation MAPK Activity RTK Activation B. 1 2
Figure S6 C. P-MAPK (T202_Y204) P-S6 (S235_S236) Relative Protein Levels Relative Protein Levels SKMEL5 D24 D29 WM1799 UCSD354 MEL624 SKMEL5 D24 D29 WM1799 UCSD354 MEL624 P-AKT (T308) Cl. Caspase 7 Relative Protein Levels Relative Protein Levels SKMEL5 D24 D29 WM1799 UCSD354 MEL624 SKMEL5 D24 D29 WM1799 UCSD354 MEL624
Figure S6 D. Tumor Suppression Apoptosis Proliferation AKT Activity RTK Activation MAPK & mTOR1/2 Activity
Figure S7 B. A. R2=0.32 p=0.03 R2=0.54 p=0.002
Figure S7 D. C. WM3854 MEL624 mRNA [Treatment : Mock] mRNA [Treatment : Mock] WM3854 E. RLU
Figure S8 A. AZD8055 SEL+8055 Mock SEL DAPI MITF Merge
Figure S8 C. MEL624 MEL624 B. RLU RLU * * * * * *
Figure S8 D. RAPTOR+RICTOR RAPOR+RICTOR RAPTOR RAPTOR RICTOR RICTOR mTOR PGC1a mTOR PGC1a MITF MITF Risc Risc PGC1α PGC1α MITF MITF mTOR mTOR Raptor Raptor Rictor Rictor P-S6(S235/236) P-S6(S235/236) S6 S6 P-4EBP1(S65) P-4EBP1(S65) P-AKT(S473) P-AKT(S473) AKT AKT MEL624 WM3854
Figure S9 A. C. SEL+AZD2014 SEL+AZD8055 AZD2014 AZD8055 Mock SEL PGC1α Relative Intensity MITF GAPDH B. Mock 2014 8055 Effect of mTORC1/2 Inhibition
Figure S10 F O B. A. OCR (pmol/min/25,000 cells) % Inhibition % Inhibition SEL (mM) Time (min) SEL (mM) C.
Figure S10 E. P-S6 D. Parental Clone R1 Clone R2 P-MAPK Clone R1 Parental Clone R2
Figure S11 B. C. A. A375 A375-R1 A375-R2 Inhibition (%) Concentration (mM) Concentration (mM) Concentration (mM) E. D. F. WM35 WM35-R1 WM35-R2 Inhibition (%) Concentration (mM) Concentration (mM) Concentration (mM)
Figure S11 G. Sel+8055 Mock Sel AZD8055 A375 A375-R1
Figure S12 A. mRNA [Prog : Pre] Patient samples
Figure S12 B. 166 Lung Cancers 59 Melanomas 59 Melanomas Relative PGC1a Expression 172 Hematopoietic & Lymphoid Cancers Cancers by Tissue Type