Download
1 / 38
480 likes | 736 Views
The Scientific Method. Created by: Mrs. Herman 2012. Scientific Method. First of all, let’s be honest. There are a lot of scientists out there that don’t really use all the parts of the scientific method every time they do an experiment.

E N D
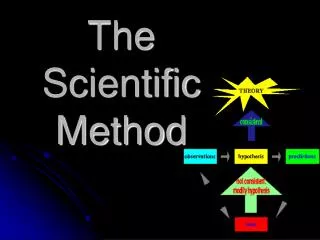
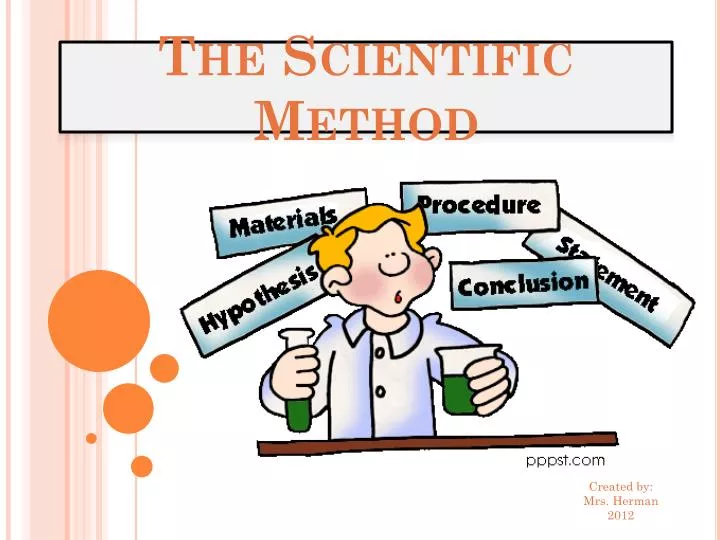
The Scientific Method Created by: Mrs. Herman 2012
Scientific Method • First of all, let’s be honest. There are a lot of scientists out there that don’t really use all the parts of the scientific method every time they do an experiment. • That being said, we’re still going to study it because it is the proper way to do it, and also the state mandates that all grade levels learn it. • But keep in mind, some of the most important science work starts when people notice something funny, then start questioning why things are happening the way they do. • Every single one of us is a scientist in our own way.
Step 1: Ask Questions Develop a question or problem that can be solved through experimentation.
Step 1: Ask Questions • A question such as “How do students learn best?” is not clear because there are too many different ways to test it. • A better question might be, “Do students learn better before or after eating?” because it only tests one particular thing. • TIP: YOU MUST BE ABLE TO MEASURE THE RESULTS IN SOME WAY FOR IT TO BE CONSIDERED A TESTABLE QUESTION.
Step 2: Observe and Research Make observations and research your topic. Observations could also come first to help develop a question
Variables in an experiment TEST VARIABLE is a variable that causes something to change. Example: In an experiment to see how different soils affect the growth (or height) of plants, the test variable would be the different kinds of soil.
Variables in an experiment OUTCOME VARIABLE Is the result of something that changed. This must be observable or measurable. Example: In an experiment to see how different soils affect the growth (or height) of plants, the outcome variable is the height of the plants.
Variables in an experiment CONSTANT are factors that do not change during an experiment. Example: In an experiment to see how different soils affect the growth (or height) of plants, the constants would be the amount of sunlight, amount of water, type of plant, etc.
Variables in an experiment CONTROL a standard against which other conditions can be compared. Example: In an experiment to see if you add sugar to the soil to help plants grow taller, your control would be a plant without the sugar. All other variables would be the same.
PRACTICE Question 1: Will more birds visit the schoolyard if we put up a birdbath? Test Variable: putting a birdbath in the school courtyard. Outcome Variable: The number of birds
PRACTICE Question 2: Does the height of the grass affect the number of robins feeding? Test Variable: height of the grass. Outcome Variable: The number of robins.
Step 3: Formulate a hypothesis • Predict a possible answer to the problem or question. • Must be written in an if/then/because statement • Example: If a plant is watered everyday, then it will grow faster because plants need water to grow.
The Scientific Method shows how Mandy set up an experiment to show the relationship between plant growth and amount of water given to the plants. The stated problem was"Does the amount of water affect the growth of bean seeds?" • Mandy's hypothesis was written in "if-then" format: "If I water my plants too little, then they will not grow very much." The if-then statement is made of the test (independent) variable and outcome (dependent) variable. So the hypothesis can be written with this style: If test variable, then outcome variable.If I don't water my plants, then they will die. If I don't study for my test, then I will fail. • A student was performing an experiment about the rate of photosynthesis in a certain type of algae when it is exposed to different colors of light. Write an if-then hypothesis about this experiment. Identify the test (independent) variables and outcome (dependent) variables.
Step 4: Experiment • Develop and follow a procedure. • Must include materials list. • Outcome must be measurable (quantifiable).
Experiment vs. Investigation • Experiment – following the scientific method and doing an experiment to find evidence to support or not support a hypothesis. • Example: Testing plant growth in different types of soils. • Investigation – Using observations to study the natural world without interference or manipulation. • Example of an investigation may be walking around school to observe and record different types of organisms in order to create a food web.
Step 5: Collect and Analyze results Includes tables, graphs, pictures, etc.
A graph is a visual representation of the data. Outcome(dependent) variable here Test (independent) variable here
Data Collection: Graphs and Charts Bar Graphs: used to show data that is not continuous. A bar graph allows us to compare data and make generalizations about the data. When creating a graph remember: EXIT E – Every X – X-axis I – is the T – test variable TAILS T – Title A – axis I – intervals L – labels S - scales TOY T – title O – outcome variable Y – Y - axis
Data Collection: Graphs and Charts Line Graphs: Used for continuous data. Useful for showing trends over time and making predictions. When creating a graph remember: EXIT E – Every X – X-axis I – is the T – test variable TAILS T – Title A – axis I – intervals L – labels S - scales TOY T – title O – outcome variable Y – Y - axis
Data Collection: Graphs and Charts San Antonio Spurs Games Won Each year
Data Collection: Graphs and Charts • Other types of graphs • A pie chart (circle graph) displays data in an easy-to-read 'pie-slice' format. Each slice represent a specific percent of a whole. • A picture graph uses pictures or symbols to show data. One picture often stands for more than one vote so a key is necessary to understand the symbols.
SI UnitsInternational Units of Measurement • What are SI units? • International System of Units allows all scientists to have a common language. • What are the base SI units? • Length meter (m) • Mass gram (g) • Volume liter (l) • Time second (s) • Temperature Kelvin (K)
SI UnitsInternational Units of Measurement kilo- hecto- Move decimal to the left deca- Base unit Move decimal to the right deci- Unit: can refer to meter, gram, or liter centi- milli-
1 2 3 MetersLitersGrams How do you use the “ladder” method? 1st – Determine your starting point. 2nd – Count the “jumps” to your ending point. 3rd – Move the decimal the same number of jumps in the same direction. Starting Point Ending Point __. __. __. 2 3 1 Ladder Method (k) KILO1000Units (h) HECTO100Units (da) DEKA10Units (d) DECI0.1Unit (c) CENTI0.01Unit (m) MILLI0.001Unit 4 km = _________ m How many jumps does it take? 4. = 4000 m
Step 6: Conclusion • Summary of information gained during experimentation. • Should be at least a paragraph or more.
Conclusion Format • State the facts! Give the exact numbers (averages only) for each test variable. • Say why! Make a statement explaining the trends you observed. Summarize your data if necessary. Why did you see those particular results? • Was your hypothesis supported? • Wrap it up! Discuss any questions you still have, what you might have done differently, and any sources or error.
Step 7: Communicate Results Present the project results to an audience.
Practice Bart Simpson believes that mice exposed to microwaves will become extra strong (maybe he’s been reading too much Radioactive Man). He decides to perform this experiment by placing 10 mice in a microwave for 10 seconds. (Do not do this at home. Bart is a misguided fictional character ) He compared these 10 mice to another 10 mice that had not been exposed. His test consisted of a heavy block of wood that blocked the mouse food. He found that 8 out of the 10 microwaved mice were able to push the block away. 7 out of the 10 non-microwaved mice were able to do the same.
Practice • Identify the problem / question • Observe / research • Hypothesis • Experiment • Collect and analyze data • Conclusion • Communicate results
Replication vs. Repetition Repetition is when the same scientist completes multiple trials to limit the bias of experiment.
Replication vs. Repetition Replicationis when a different scientist completes the experiment by following the procedures. Replication is done to get same/similar results which create the validity of experiment.
PRACTICE Can you explain the difference between repetition and replication and identify their role in a controlled experiment? Which picture below represents replication and which represents repetition? Repetition – same scientist Replication – different scientist
Why would a scientist use repetition in an experiment? To verify the accuracy and results of the experiment. To find possible flaws in their experiment Why would a scientist replicate an experiment? So scientists can check to see if a controlled experiment was conducted and that good scientific practices were used. This is called peer review