Download
1 / 11
110 likes | 176 Views
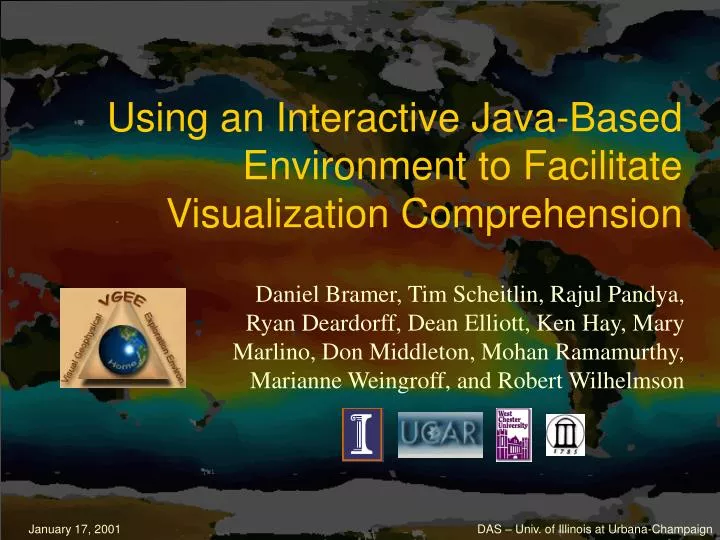
Using an Interactive Java-Based Environment to Facilitate Visualization Comprehension. Daniel Bramer, Tim Scheitlin, Rajul Pandya, Ryan Deardorff, Dean Elliott, Ken Hay, Mary Marlino, Don Middleton, Mohan Ramamurthy, Marianne Weingroff, and Robert Wilhelmson.

E N D
Using an Interactive Java-Based Environment to Facilitate Visualization Comprehension Daniel Bramer, Tim Scheitlin, Rajul Pandya, Ryan Deardorff, Dean Elliott, Ken Hay, Mary Marlino, Don Middleton, Mohan Ramamurthy, Marianne Weingroff, and Robert Wilhelmson DAS – Univ. of Illinois at Urbana-Champaign
Visual Geophysical Exploration EnvironmentVGEE • Simpler Visualization Environment • Guidance for Key Concepts • Isolate Processes Within Complex Systems
Java / GDV / VisAD • Java 1.3 (application) • Easy exchange between VGEE components • Underlying 3D Viz. Environment • Leveraged from GDV and VisAD • GDV – 3D Gridded Data Viewer (UNIDATA) • VisAD – Java Visualization Component Library (SSEC / UNIDATA / NCSA / Aus. Bureau of Meteorology
Visualization State Track/update/change parameters Launch new viz tools Main Display Displays visualization information Interactive Versatile Uses canned and user supplied datasets Probe Window Displays specific isolated information from the overall visualization Graphical User Interface (GUI)
VGEE GUI • Learner Friendly • Explore and Interact in 3-D • Same tools as researchers, but set for survey level Viz: El Nino avg. DJF vertical wind speed cross-section and isosurface
Concept Models / Probes • Concept Models • Stand-Alone • Teach basic principles in a user controlled environment • Probes • Isolate processes form the overall system • Relate learned concepts to the “real” world
Temperature Condensation Ocean Evaporation Dry Adiabatic Moist Adiabatic Custom Moist Adiabatic Ekman Wind Balance Coriolis Force Concept Models
Probes • Same as Concept Models • Integrate with Dataset(s) Viz: Height (plan) Temperature (cross-section) with jet (isosurface)
Web site: www.dlese.org/vgee • Learner Guides • Focused Activities • Teacher Guides • Guidance • Work Submission • Encyclopedia
Implementation • West Chester University • Spring 2002 • University of Illinois • Summer / Fall 2002
Acknowledgements • This project is funded by the National Science Foundation Division of Undergraduate Education Grant #DUE-9972491. Website http://www.dlese.org/vgee