Download
1 / 30
300 likes | 314 Views
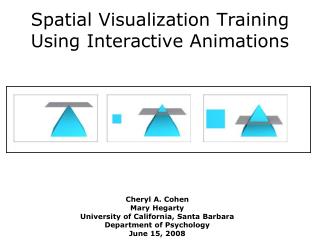
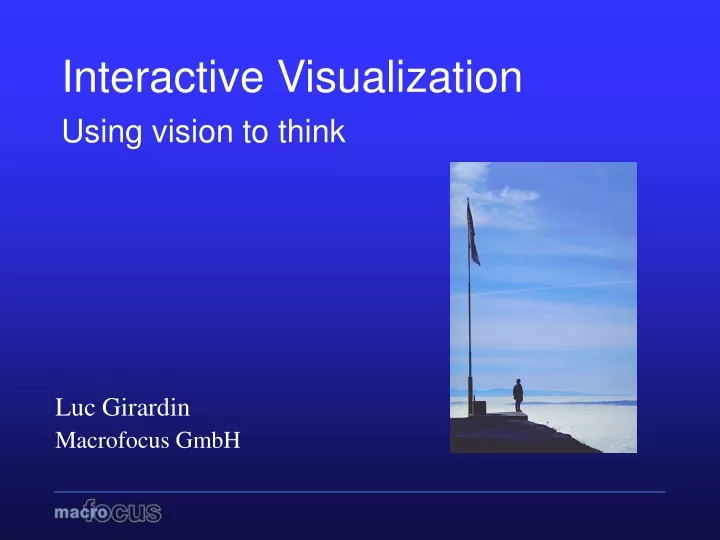
Interactive Visualization Using vision to think. Luc Girardin Macrofocus GmbH. Overview. Introduction An example: Economic Research Interactive Visualization Another example: Investment Funds Summary. What is the problem?.

E N D
Interactive VisualizationUsing vision to think Luc Girardin Macrofocus GmbH
Overview • Introduction • An example: Economic Research • Interactive Visualization • Another example: Investment Funds • Summary Interactive Visualization
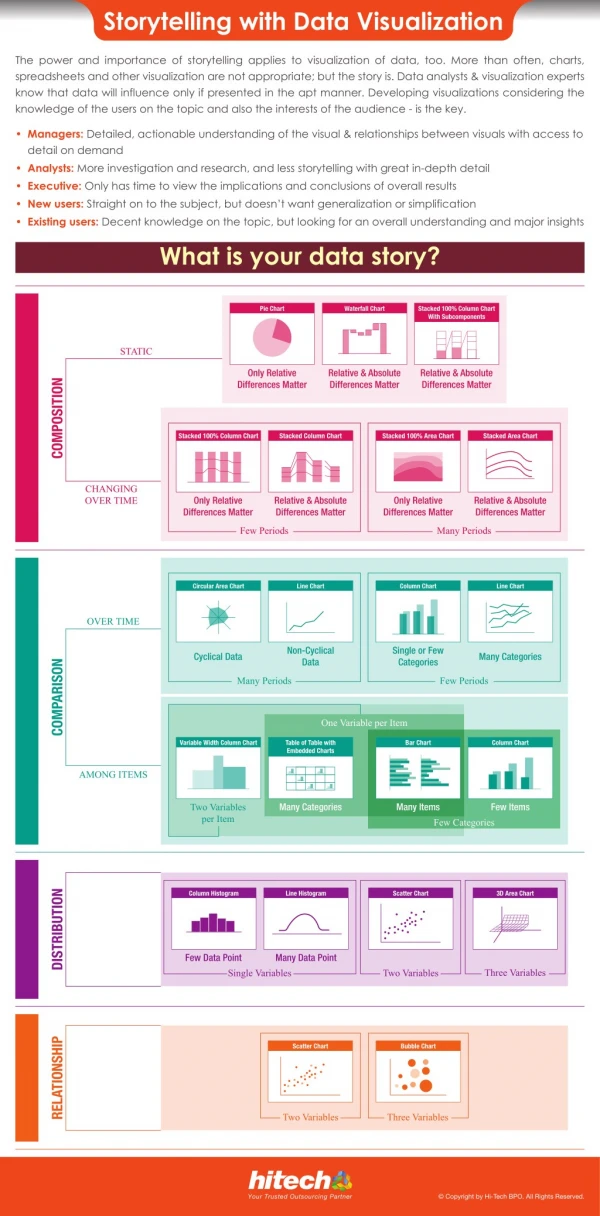
What is the problem? • Amounts of complex data growing faster than capability to analyze it • We know how to collect data and build big data warehouses but… We are lost in this space • Data Information Knowledge Interactive Visualization
Example: Economic research • Survey of prices and earnings in 60 cities around the world • Each city characterized by 40+ different attributes Interactive Visualization
City’O’Scope Demo Interactive Visualization
Interactive visualization • Use perceptual skills • Provide an overview of global relationships • Frame of reference to embed fine grained tasks • Overview – Zoom in – Details on demand • Encourage exploration and comparison • Reveal the data at several levels of detail Interactive Visualization
Our approach • Integrated systems • Preserve context • Different views • Tightly linked • Highly interactive Interactive Visualization
- Is this an outlier? - Are there groups of similar objects? - How do these groups relate to each other? - What is this object? - Why is it an outlier? - If I change this parameter a little bit, . how will the result be affected?
A different approach… Interactive Visualization
Fund’O’Scope Demo Interactive Visualization
Spring-based layout algorithm Interactive Visualization
i-lists before after Interactive Visualization
-blended parallel coordinates before after Interactive Visualization
What did we learn? • Not enough to connect database to the Web • Tools that fit the way we think and work • Easier and faster data access • Better understanding of information space • Discover new relationships, anomalies Interactive Visualization
www.macrofocus.com E-mail: info@macrofocus.com
Nanotechnology Interactive Visualization
From the lab… Interactive Visualization
…to the Web Interactive Visualization
Atom’O’Scope Demo Interactive Visualization