Download
1 / 31
310 likes | 445 Views
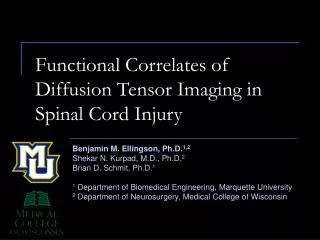
FADTTS: Functional Analysis of Diffusion Tensor Tract Statistics. Hongtu Zhu, Ph.D. Department of Biostatistics and Biomedical Research Imaging Center, University of North Carolina at Chapel Hill. Outline. Motivation Multivariate Varying Coefficient Models Simulation Studies

E N D
FADTTS: Functional Analysis of Diffusion Tensor Tract Statistics Hongtu Zhu, Ph.D. Department of Biostatistics and Biomedical Research Imaging Center, University of North Carolina at Chapel Hill
Outline Motivation Multivariate Varying Coefficient Models Simulation Studies Real Data Analysis
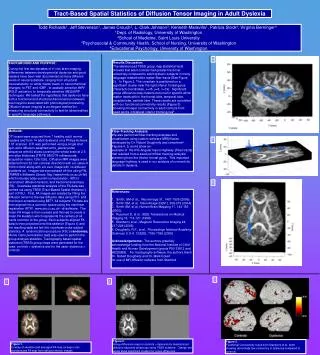
Motivation group 1 group 2 • Structural Connectivity • Functional Connectivity Anatomical MRI, DTI (HARDI) EEG, fMRI, resting fMRI
Neonatal Brain Development Motivation PI: John H. Gilmore. www.google.com Knickmeyer RC, et al.J Neurosci, 2008 28: 12176-12182.
Early Brain Development Motivation 2 year 1 year 2 week Knickmeyer RC, et al.J Neurosci, 2008 28: 12176-12182.
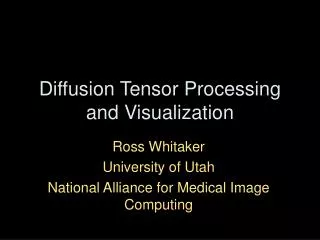
Diffusion Tensor Tract Statistics Motivation FA Tensor 1 year 2 year 1 year 2 year 2 week 2 week
Motivation MacaqueBrain Development PI: Martin Styner & Marc Niethammer. Casey, B.J. et al. TRENDS in Cognitive Sciences, 2005 9(3): 104-110.
Motivation Casey, B.J. et al. TRENDS in Cognitive Sciences, 2005 9(3): 104-110.
Motivation Casey, B.J. et al. TRENDS in Cognitive Sciences, 2005 9(3): 104-110.
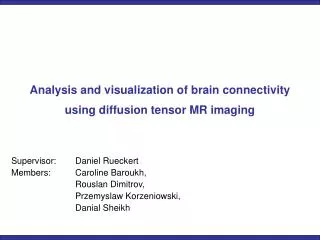
Functional Analysis of Diffusion Tensor Tract Statistics Data • Diffusion properties (e.g., FA, RA) • Grids (e) • Covariates (e.g., age, gender, diagnostic)
Multivariate Varying Coefficient Model Decomposition: High Frequency Noise Varying Coefficients Low Frequency Signal Covariance operator:
Weighted Least Squares Estimate Key Advantage Low Frequency Signal
Functional Principal Component Analysis Smooth individual functions Estimated covariance operator Estimated eigenfunctions
Statistical Inferences Testing Linear Hypotheses Grid Point Whole Tract Global Test Statistics Local Test Statistics
Confidence Band Asymptotics Critical point Confidence band
Comparisons • Pros • Directly smooth varying coefficient functions • Explicitly account for functional nature of tract statistics • Characterize low frequency signal • Drop high frequency noise • Increase statistical power • Cons • Complicated asymptotic results • Computationally intensive
Simulation Studies Model Setting
Simulation Studies Testing
Real Data Analysis Early Brain Development Casey, B.J. et al. TRENDS in Cognitive Sciences, 2005 9(3): 104-110.
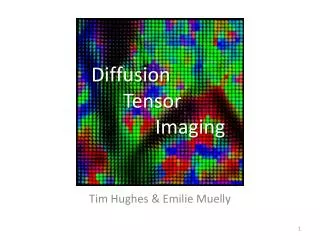
Real Data Analysis Splenium 128 subjects Diffusion properties = Gender + Gestational age
Confidence Bands Intercept Gender Age FA MD
Functional Principal Component Analysis MD FA Eigenvalues
FADTTS GUI Toolbox Input: Raw data and test data. Raw data include tract data, design data and diffusion data. Test data include test matrix and vector. All data is in .mat format. Output: Basic plots and P-value plots Basic plots include diffusion plot, coefficient plot, eigenvalue and eigenfunction plot, confidence band plot. P-value plot include local p-value (in –log10 scale) plot with global p-value. Download: FADTTS GUI Toolbox with related documents and sample data is free to download from http://www.nitrc.org/projects/fadtts/
Summary • From the statistical end, we have developed a new functional analysis pipeline for delineating the structure of the variability of multiple diffusion properties along major white matter fiber bundles and their association with a set of covariates of interest. • From the application end, FADTTS is demonstrated in a clinical study of neurodevelopment for revealing the complex inhomogeneous spatiotemporal maturation patterns as the apparent changes in fiber bundle diffusion properties. • We developed a GUI Tool box to facilitate the application of FADTTS.
Future Research • extend FADTTS to the analysis of high angular resolution diffusion image (HARDI). • extend FADTTS to principal directions and full diffusion tensors on fiber bundles. • extend to more complex fiber structures, such as the medial manifolds of fiber tracts. • extend FADTTS to longitudinal studies and family studies.
References • Zhu, H.T., Kong, L.L., Li, R.Z., Styner, M., Gerig, G., Lin, W.L., Gilmore, J. H. (2011). FADTTS: Functional Analysis of Diffiusion Tensor Tract Statistics varying coefficient models for DTI tract statistics. Neuroimage, in press. • Zhu, H.T., Li, R. Z., Kong, L.L. (2011). Multivariate varying coefficient models for functional responses. Submitted. • Zhu, H., Styner, M., Li, Y., Kong, L., Shi, Y., Lin, W., Coe, C., and Gilmore, J. (2010). Multivariate varying coefficient models for DTI tract statistics. In Jiang, T., Navab, N., Pluim, J., and Viergever, M., editors, Medical Image Computing and Computer-Assisted Intervention MICCAI 2010, volume 6361 of Lecture Notes in Computer Science, pages 690-697. Springer Berlin / Heidelberg. • NICTR Toolbox (2011). FADTTS: Functional Analysis of Diffusion Tensor Tract Statistics. http://www.nitrc.org/projects/fadtts/