Download
1 / 18
180 likes | 309 Views
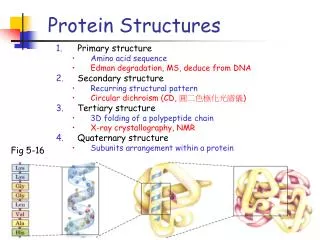
Analysis of the Quality of NMR Protein Structures. With A Structure Calculated From Your NMR Data, How Do You Determine the Accuracy and Quality of the Structure? Consistency with Known Protein Structural Parameters bond lengths, bond angles, dihedral angles, VDW interactions, etc

E N D
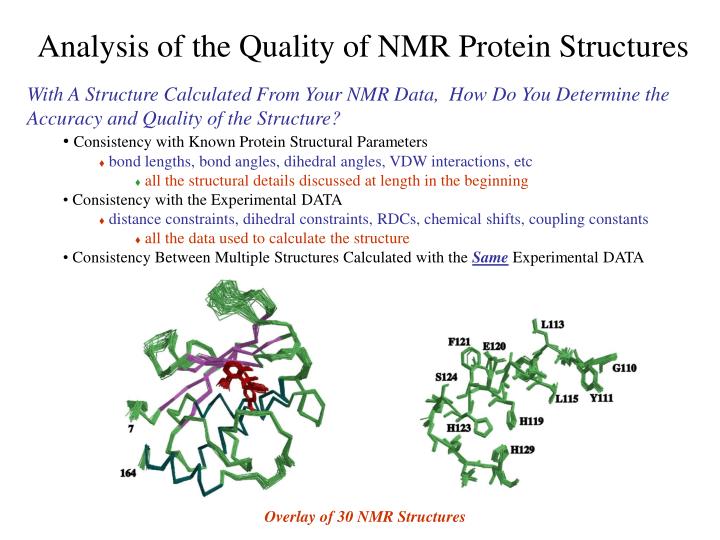
Analysis of the Quality of NMR Protein Structures • With A Structure Calculated From Your NMR Data, How Do You Determine the Accuracy and Quality of the Structure? • Consistency with Known Protein Structural Parameters • bond lengths, bond angles, dihedral angles, VDW interactions, etc • all the structural details discussed at length in the beginning • Consistency with the Experimental DATA • distance constraints, dihedral constraints, RDCs, chemical shifts, coupling constants • all the data used to calculate the structure • Consistency Between Multiple Structures Calculated with the Same Experimental DATA Overlay of 30 NMR Structures
Analysis of the Quality of NMR Protein Structures • As We have seen before, the Quality of X-ray Structures can be monitored by an R-factor • No comparable function for NMR • Requires a more exhaustive analysis of NMR structures
Analysis of the Quality of NMR Protein Structures • Root-Mean Square Distance (RMSD) Analysis of Protein Structures • A very common approach to asses the quality of NMR structures and to determine the relative difference between structures is to calculate an rmsd • an rmsd is a measure of the distance separation between equivalent atoms • two identical structures will have an rmsd of 0Å • the larger the rmsd the more dissimilar the structures 0.81 ± 0.09 Å for all atoms 0.43 ± 0.06 Å for the backbone atoms
Analysis of the Quality of NMR Protein Structures • Root-Mean Square Distance (RMSD) Analysis of Protein Structures • A variety of approaches can be used to measure an RMSD • only backbone atoms • exclude disordered regions • only regions with defined secondary structure • only the protein’s active-site region • on a per-atom or per-residue basis rmsd difference between NMR and X-ray structure
Analysis of the Quality of NMR Protein Structures • Root-Mean Square Distance (RMSD) Analysis of Protein Structures • Using XPLOR to measure an RMSD • only one PSF file can be used • the structures being compared have to be consistent with the PSF file • can only compare similar structures/sequence • can not compare structural homologs structure @PROTEIN.psf end set precision 3 end evaluate ($1= “PROTEIN_ave.min") set display=all_all.rms end display $1 set display=back_all.rms end display $1 coor disp=comp @@$1 for $2 in ( “PROTEIN_dg_103.sam" “PROTEIN_dg_3.sam“ . . . “PROTEIN_dg_18.sam" “PROTEIN_dg_84.sam" ) Read in the PSF file and identify the reference structure Name the files to contain the rmsd data Compare the coordinates Loop through a list of files to compare against PROTEIN_ave.min
Analysis of the Quality of NMR Protein Structures Continuation of XPLOR Script The following set of commands are executed for each protein in the list loop fil2 coor @@$2 coor select ((not hydro) and (resid 4:81 or resid 90:111)) fit end coor select ((not hydro) and (resid 4:81 or resid 90:111)) rms end evaluate ($20=$result) set display all_all.rms end display $2 $20 coor select ((name ca or name c or name n) and (resid 4:81 or resid 90:111)) fit end coor select ((name ca or name c or name n) and (resid 4:81 or resid 90:111)) rms end set display back_all.rms end evaluate ($20=$result) display $2 $20 end loop fil2 stop First, the structures are aligned based on the selected atoms Then, an rmsd is calculated based on the selected atoms and written to the specified file Selection tool is very flexible and you can choose a variety of atom names, types, residue names and types and chains
Analysis of the Quality of NMR Protein Structures • Some Caveats About (RMSD) Analysis of Protein Structures • rmsd is a global measure • an unexpected high or low value may reflect only a region of the protein that is ordered/disordered or similar/dissimilar • For an ensemble of NMR structures, rmsd implies precision • accuracy can be inferred by comparing structures determined by multiple methods and groups • Highrmsd is an indicator of protein dynamics • This is generally true, but it strongly depends on the completeness and accuracy of analyzing the NOESY data. • regions of mobility need to be confirmed by experimental measurments • high rmsd is directly related to the number of distance constraints
Analysis of the Quality of NMR Protein Structures • Literature Reports of NMR Protein Structures • RMSD provides a means to evaluate the quality of the structures • Always calculate multiple structures (10-100) with a single experimental data set • identify the lowest energy structures (10-30) <SA> • calculate an “average” structure (SA) • minimize the “average” structure (SA)r against the NMR experimental constrains • calculate rmsd between the ensemble of structures (<SA>), (SA), (SA)r and x-ray structure (if available)
Analysis of the Quality of NMR Protein Structures • What is an “Average” NMR Structure? • Average the x,y,z-coordinate positions for each atom over the entire ensemble of structures Structure 1: ATOM 1 N MET 1 0.825 20.945 0.300 Structure 2: ATOM 1 N MET 1 3.524 22.037 -0.733 Structure 3: ATOM 1 N MET 1 -0.813 21.297 -1.463 . . . Align the structures and calculate an average Average Structure: ATOM 1 N MET 1 2.888 21.188 -0.390
Analysis of the Quality of NMR Protein Structures • Is the “Average” NMR Structure a Real Structure? • No-it is a distorted structure • level of distortions depends on the similarity between the structures in the ensemble • provides a means to measure the variability in atom positions between an ensemble of structures Expanded View of an “Average” Structure Some very long, stretched bonds Position of atoms are so scrambled the graphics program does not know which atoms to draw bonds between Some regions of the structure can appear relatively normal
Analysis of the Quality of NMR Protein Structures • Refine or Minimize the “Average” NMR Structure • Remove “bad” bond lengths, angles, etc • Minimize against the experimental NMR data • Is this structure a “true” representation of the average of the ensemble of structures? • A point of discussion in the NMR community • an overlay of the refined average structure with the ensemble of structures will place the average in the center of the structures • Alternative view is to select one structure from the ensemble • Does this represent the average of the ensemble? Overlay of backbone atoms for the refined minimized structure (blue) and ensemble of 30 structures (yellow)
Analysis of the Quality of NMR Protein Structures • Structural Statistics Provide Another Approach to Quantify the Quality of an NMR Structure • r.m.s deviations from experimental restraints • energies • NOE violations, torsional angle violations, repulsive forces, Lennard-Jones electrostatics (not a target function in refinement) • deviations from idealized covalent geometry • PROCHECK • G-factor, Ramachandran, bad contacts hydrogen bond energy
Analysis of the Quality of NMR Protein Structures Energies, violations and rms deviations are routinely printed as headers in XPLOR Structure files REMARK FILENAME=“PROTEIN.sam"REMARK =============================================================== REMARK overall, bonds, angles, improper,vdw, REMARK energies: -580.981, 51.7637, 218.963, 42.2728, 177.029, REMARK cdih, noe, coup, shift, rama, coll REMARK energies: 19.8689, 104.49, 18.5721, 62.6244, -1404.57, 128.003 REMARK =============================================================== REMARK bonds, angles, impropers, cdih, noe, coup REMARK RMS: 5.096347E-03, 0.616985, 0.51284, 1.21754, 3.558853E-02, 0.591961 REMARK shifts RMS a, b: 0.883305, 0.89601 REMARK =============================================================== REMARK cdih coup noe REMARK violations : 3 7 3 REMARK shifts: 55 REMARK =============================================================== REMARK REMARK jcoup rms-d: 0.591961 REMARK =============================================================== REMARK =============================================================== REMARK =============================================================== REMARK DATE:16-Feb-04 17:50:26 created by user:
Analysis of the Quality of NMR Protein Structures Structural Statistics Provide Another Approach to Quantify the Quality of an NMR Structure . . . cons inter (all) (all) end print threshold = 0.01000 collapse evaluate ($rms_col=$result) evaluate ($violations_col=$violations) print threshold = 0.10000 noe evaluate ($rms_noe=$result) evaluate ($violations_noe=$violations) print threshold = 1.0000 cdih evaluate ($rms_cdih=$result) evaluate ($violations_cdih=$violations) print threshold = 0.0500 bonds evaluate ($rms_bonds=$result) print threshold = 10.0000 angles evaluate ($rms_angles=$result) evaluate ($violations_angles=$violations) print threshold = 3.0000 impropers evaluate ($rms_impropers=$result) evaluate ($violations_improp=$violations) . . . Sets the thresholds for which violations will be reported Obtaining rms deviations of experimental restraints, energies and deviations from idealized geometry by simply printing the values from XPLOR
Analysis of the Quality of NMR Protein Structures Typical Output of an XPLOR restraint analysis where violated restraints are listed followed by a summary . . . ========== spectrum 1 restraint 2745 ========== set-i-atoms 93 ALA HN set-j-atoms78 VAL O R<average>= 2.469 NOE= 1.80 (- 0.30/+ 0.50) Delta= -0.169 E(NOE)= 1.432========== spectrum 1 restraint 2747 ========== set-i-atoms 76 GLY HN set-j-atoms95 VAL O R<average>= 2.457 NOE= 1.80 (- 0.30/+ 0.50) Delta= -0.157 E(NOE)= 1.230NOEPRI: RMS diff. = 0.040, #(violat.> 0.1)= 69 of 2750 NOEs NOEPRI: RMS diff. class INTR = 0.004, #(viol.> 0.1)= 0 of 483 NOEs NOEPRI: RMS diff. class SHOR = 0.035, #(viol.> 0.1)= 22 of 825 NOEs NOEPRI: RMS diff. class LONG = 0.040, #(viol.> 0.1)= 20 of 651 NOEs NOEPRI: RMS diff. class SEQ = 0.046, #(viol.> 0.1)= 10 of 719 NOEs NOEPRI: RMS diff. class H-BO = 0.104, #(viol.> 0.1)= 17 of 72 NOEs X-PLOR>evaluate ($rms_noe=$result) EVALUATE: symbol $RMS_NOE set to 0.399183E-01 (real) X-PLOR>evaluate ($violations_noe=$violations) EVALUATE: symbol $VIOLATIONS_NOE set to 69.0000 (real). . . Violated NOE restraint, average distance, error and energy RMS summary and number of violated restraints
Analysis of the Quality of NMR Protein Structures • As We Discussed Before, PROCHECK is a Very Valuable Tool For Accessing The Quality of a Protein Structure • Correct f, y, c1, c2 distribution • Comparison of main chain and side-chain parameters to standard values
Analysis of the Quality of NMR Protein Structures • Predict NOEs from the Experimental Structure and Compare to the NOESY Data • short distances observed in the structure should correlate with NOE cross-peaks • missing NOE peaks may arise because of: • degeneracy • too close to diagonal • overlap with noise • disordered region of the structure ======================================== set-i-atoms 2 THR HN set-j-atoms 1 MET HT1 1 MET HT2 1 MET HT3 ( ( <R^-6> )^-1/6 ) = 1.684 ======================================== set-i-atoms 2 THR HN set-j-atoms 1 MET HA ( ( <R^-6> )^-1/6 ) = 3.404 ======================================== set-i-atoms 2 THR HN set-j-atoms 1 MET HB1 1 MET HB2 ( ( <R^-6> )^-1/6 ) = 4.137 ======================================== while ($3 < 113) loop select evaluate ($4 = $3 + 1) noe set display $2 end set print $2 end predict from=(resid $3 and name h*) to=(resid $4:113 and name h* ) cutoff=4.5 end end evaluate ($3=$3+1) end loop select end loop dist Lists all the predicted NOEs between the selected atom pairs within the given distance cut-off
Analysis of the Quality of NMR Protein Structures • NMR R-factor • difference between expected and observed NOEs • expected NOEs structure • observed NOEs NMR spectra • also includes unassigned NOEs • perfect fit would yield R = 0 • R-factors have not been readily adapted in NMR community • affected by completeness of assignments, peak overlap, sensitivity, noise, extent of data (RDCs, coupling constants, etc • trends with rmsd without complications Journal of Biomolecular NMR, 17: 137–151, 2000.