Download
1 / 34
350 likes | 473 Views
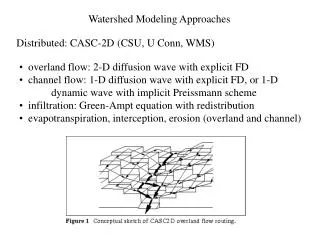
CABY Watershed Modeling with WEAP. Stockholm Environment Institute Natural Heritage Institute. CABY Planning Meeting May 6 2006. David Purkey and David Yates. Application of WEAP to the American River Basin. Catchment Delineation. Based on six digit hydrologic units (HUC6).

E N D
CABY Watershed Modeling with WEAP Stockholm Environment Institute Natural Heritage Institute CABY Planning Meeting May 6 2006 David Purkey and David Yates
Catchment Delineation • Based on six digit hydrologic units (HUC6). • HUCs were subdivided if necessary to calculate inflows to key reservoirs. • In addition to 56 catchments in the American River Basin, the Camp Creek and Sly Park Creek catchments were added to compute inflow to Jenkinson Lake.
Catchment Characterization • Land was categorized using the SSURGO soils and the CALVEG vegetation databases. • Soils were classified as shallow or deep. • Vegetation was classified as trees, shrubs, bare, urban, grassland, or wet. • Resulting classifications were • Deep trees • Shallow trees • Deep shrubs • Etc.
Modeled Reservoirs French Meadows Hell Hole Loon Lake Union Valley Echo Stumpy Mdw Ice House Aloha Folsom Sly Park Caples & Silver
Climate Data • DAYMET.org (Univ. Montana & NCAR) • Daily, 1-km gridded data were mapped o the centroids of each suib-catchment • Precipitation, temperature, humidity, and wind. • Data were developed using observed climate data and terrain models.
Probabilistic assessment of regional climate change A Bayesian approach that combines predictions from multiple AOGCM output (21 models) Probabilistic representation of temperature/precipitation change, at regional scales, incorporating natural variability Reconciles projections from different AOGCMs BIAS and CONVERGENCE criteria: Reward models that perform well in reproducing current climate/ discount models that show a large bias Reward models that form a consensus/downweight extreme Projections Avoids the Problems of being “Married” to individual GCM!!
Climate Scenarios- Probabilistic Projections A1B Seasonal Changes for Northern California from 21 AOGCMs Precipitation Winter- equal likelihood of more or less precip.; no strong long term trend Spring, SummerFall- more likelihood of less precip. Winter Spring Summer Fall
Climate Scenarios- Probabilistic Projections A1B Seasonal Changes for Northern California from 21 AOGCMs Temperature Early 21st Century warming of 0.8C Natural variability could mask early 21st century anthropogenic warming. Winter Spring Summer Fall
Climate Scenarios - Probabilistic Projections • These probabilistic projections are useful, for getting a “feel” for the climatic range suggested by AOGCM models. • BUT.. How do we use this information given impact assessment needs? • Impact assessment models need “REAL DATA” .. E.g. Climate time series, such as temperature, precipitation, wind, humidity, etc. This is the downscaling process…
Climate Scenarios - Probabilistic ProjectionsK-Nearest Neighbor Downscaling Hist Avg. Tmp Hist Avg Pcp Yates et al. 2003, A K-nn algorithm for generating regional climate scenarios, WRR
Climate Scenarios- Probabilistic Projections Monthly Avg. Temperature for Alder Creek - 2010 to 2030 WmDry 1 WmWet 1 C historic WmDry 5 WmWet 5
Climate Scenarios- Probabilistic Projections Monthly Total Precipitation Data for Alder Creek – 2010 to 2030 WmWet 1 WmDry 1 mm historic WmDry 5 WmWet 5 mm
North and Middle Forks French Meadows Hell Hole
Runoff North Fork American cms historic
Climate Change and Hydropower for the main projects An ensemble of climate projections and their impacts on hydropower Gw-hrs Headline: Even Wet scenarios suggest a decline in production with given operating rules.
North Fork Water Temps- Unmanaged Watershed WARM Dry WARM Very Dry
Middle Fork Water Temps – Managed Watershed WARM Dry WARM Very Dry