Download
1 / 1
20 likes | 117 Views
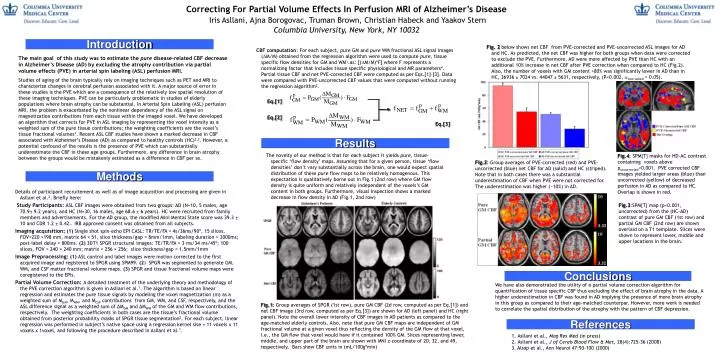
Correcting For Partial Volume Effects In Perfusion MRI of Alzheimer’s Disease Iris Asllani, Ajna Borogovac, Truman Brown, Christian Habeck and Yaakov Stern Columbia University, New York, NY 10032. Eq.[1]. Eq.[2].

E N D
Correcting For Partial Volume Effects In Perfusion MRI of Alzheimer’s Disease Iris Asllani, Ajna Borogovac, Truman Brown, Christian Habeck and Yaakov Stern Columbia University, New York, NY 10032 Eq.[1] Eq.[2] Fig.2: Group averages of PVE-corrected (red) and PVE-uncorrected (blue) net CBF for AD (solid) and HC (striped). Note that in both cases there was a substantial underestimation of CBF when PVE were not corrected for. The underestimation was higher (~10%) in AD. Introduction Fig. 2 below shows net CBF from PVE-corrected and PVE-uncorrected ASL images for AD and HC. As predicted, the net CBF was higher for both groups when data were corrected to exclude the PVE. Furthermore, AD were more affected by PVE than HC with an additional 10% increase in net CBF after PVE correction when compared to HC (Fig.2). Also, the number of voxels with GM content >80% was significantly lower in AD than in HC, 36936 ± 7024 vs. 44047 ± 5631, respectively, (P<0.002, two-tailed = 0.05). CBF computation: For each subject, pure GM and pure WM fractional ASL signal images (M/M) obtained from the regression algorithm were used to compute pure, tissue specific flow densities for GM and WM1.as: [(M/M)*F] where F represents a normalizing factor that includes tissue specific physiological and MR parameters4. Partial tissue CBF and net PVE-corrected CBF were computed as per Eqs.[1]-[3]. Data were compared with PVE-uncorrected CBF values that were computed without running the regression algorithm2. The main goal of this study was to estimate the pure disease-related CBF decrease in Alzheimer’s Disease (AD) by excluding the atrophy contribution via partial volume effects (PVE) in arterial spin labeling (ASL) perfusion MRI. Studies of aging of the brain typically rely on imaging techniques such as PET and MRI to characterize changes in cerebral perfusion associated with it. A major source of error in these studies is the PVE which are a consequence of the relatively low spatial resolution of these imaging techniques. PVE can be particularly problematic in studies of elderly populations where brain atrophy can be substantial. In Arterial Spin Labeling (ASL) perfusion MRI, the problem is exacerbated by the nonlinear dependency of the ASL signal on magnetization contributions from each tissue within the imaged voxel. We have developed an algorithm that corrects for PVE in ASL imaging by representing the voxel intensity as a weighted sum of the pure tissue contributions; the weighting coefficients are the voxel’s tissue fractional volumes1. Recent ASL CBF studies have shown a marked decrease in CBF associated with Alzheimer’s Disease (AD) as compared to healthy controls (HC)2,3. However, a potential confound of the results is the presence of PVE which can substantially underestimate the CBF in these age groups. Furthermore, any difference in brain atrophy between the groups would be mistakenly estimated as a difference in CBF per se. Eq.[3] Results The novelty of our method is that for each subject it yields pure, tissue-specific ‘flow density’ maps. Assuming that for a given person, tissue ‘flow densities’don’t vary substantially across the brain, one would expect spatial distribution of these pure flow maps to be relatively homogenous. This expectation is qualitatively borne out in Fig.1 (2nd row) where GM flow density is quite uniform and relatively independent of the voxels’s GM content in both groups. Furthermore, visual inspection shows a marked decrease in flow density in AD (Fig.1, 2nd row) Fig.4: SPM{T} masks for HD-AC contrast containing voxels above puncorrected<0.001. PVE corrected CBF images yielded larger areas (blue) than uncorrected (yellow) of decreased perfusion in AD as compared to HC. Overlap is shown in red. Methods Details of participant recruitement as well as of image acquisition and processing are given in Asllani et al.2. Briefly here: Study Participants:ASL CBFimages were obtained from two groups: AD (N=10, 5 males, age 70.9± 9.2 years), and HC (N=30, 16 males, age 68.6 ± 6 years). HC were recruited from family members and advertisements. For the AD group, the modified Mini Mental State score was 39.3 ± 10 and CDR 1.2 ± 0.42.. IRB approved consent was obtained from all subjects. Imaging acquisition: (1)Single shot spin-echo EPI CASL: TR/TE/FA = 4s/36ms/90º, 15 slices, FOV=220 ×198 mm, matrix 64 × 51, slice thickness/gap = 8mm/1mm, labeling duration = 2000ms; post-label delay = 800ms. (2) 3DT1 SPGR structural images: TE/TR/FA = 3 ms/34 ms/45º; 100 slices, FOV = 240 × 240 mm; matrix = 256 × 256; slice thickness/gap = 1.5mm/1mm Image Preprocessing: (1)ASL control and label images were motion corrected to the first acquired image and registered to SPGR using SPM99. (2) SPGR was segmented to generate GM, WM, and CSF matter fractional volume maps. (3) SPGR and tissue fractional volume maps were coregistered to the EPIs. Partial Volume Correction: A detailed treatment of the underlying theory and methodology of the PVE correction algorithm is given in Asllani et al.1. The algorithm is based on linear regression and estimates the pure tissue signals by modeling the voxel magnetization (m) as a weighted sum of MGM, MWM, and MCSF contributions from GM, WM, and CSF, respectively, and the ASL difference signal as a weighted sum of ΔMGM and ΔMWM of the GM and WM flow contributions, respectively. The weighting coefficients in both cases are the tissue’s fractional volume obtained from posterior probability masks of SPGR tissue segmentation2. For each subject, linear regression was performed in subject’s native space using a regression kernel sise = 11 voxels x 11 voxels x 1voxel, and following the procedure described in Asllani et al.1. Fig.3:SPM{T} map (p<0.001, uncorrected) from the (HC-AD) contrast of pure GM CBF (1st row) and partial GM CBF (2nd row) are shown overlaid on a T1 template. Slices were shown to represent lower, middle and upper locations in the brain. Conclusions We have also demonstrated the utility of a partial volume correction algorithm for quantification of tissue specific CBF thus excluding the effect of brain atrophy in the data. A higher underestimation in CBF was found in AD implying the presence of more brain atrophy in this group as compared to their age-matched counterpar. However, more work is needed to correlate the spatial distribution of the atrophy with the pattern of CBF depression. Fig.1: Group averages of SPGR (1st row), pure GM CBF (2d row, computed as per Eq.[1]) and net CBF image (3rd row, computed as per Eq.[3]) are shown for AD (left panel) and HC (right panel). Note the overall lower intensity of CBF images in AD patients as compared to the age-matched elderly controls. Also, note that pure GM CBF maps are independent of GM fractional volume at a given voxel thus reflecting the density of the GM flow at that voxel, I.e., the GM flow that voxel would have if it contained 100% GM. Slices representing lower, middle, and upper part of the brain are shown with MNI z-coordinate of 20, 32, and 49, respectively. Bars show CBF units in (mL/100g*min) References Asllani et al., Mag Res Med (in press) Asllani et al., J of Cereb Blood Flow & Met, 28(4):725-36 (2008) 3. Alsop et al., Ann Neurol 47:93-100 (2000)