Download
1 / 17
170 likes | 371 Views
Chaperone protein dnaK (HSP 70) Mycobacterium paratuberculosis matched 7/ A.A. cover 22%. HSP 65 Mycobacterium sp. graecum DL049 matched 6 / A.A. cover 19%. MNO Mycobacterium sp. strain JC1 matched 13 / A.A. cover 41%. probable atpD protein Mycobacterium tuberculosis

E N D
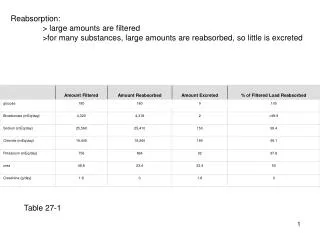
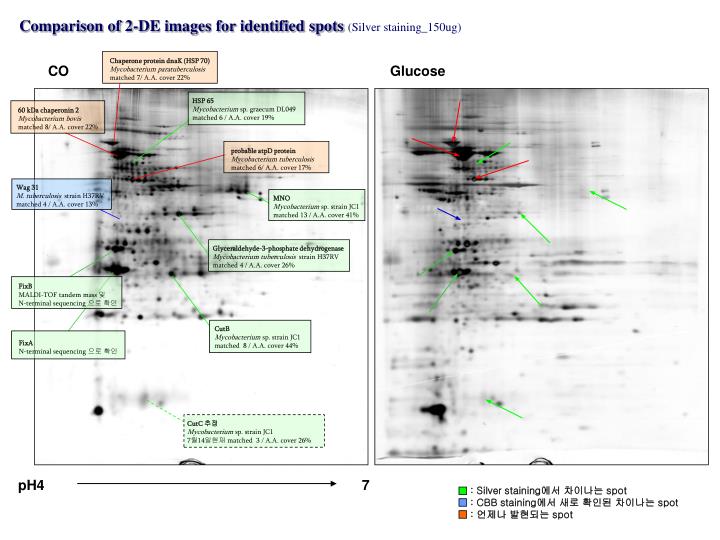
Chaperone protein dnaK (HSP 70) Mycobacterium paratuberculosis matched 7/ A.A. cover 22% HSP 65 Mycobacterium sp. graecum DL049 matched 6 / A.A. cover 19% MNO Mycobacterium sp. strain JC1 matched 13 / A.A. cover 41% probable atpD protein Mycobacterium tuberculosis matched 6/ A.A. cover 17% Wag 31 M. tuberculosis strain H37RV matched 4 / A.A. cover 13% 60 kDa chaperonin 2 Mycobacterium bovis matched 8/ A.A. cover 22% CutB Mycobacterium sp. strain JC1 matched 8 / A.A. cover 44% Glyceraldehyde-3-phosphate dehydrogenase Mycobacterium tuberculosis strain H37RV matched 4 / A.A. cover 26% FixB MALDI-TOF tandem mass및 N-terminal sequencing 으로 확인 FixA N-terminal sequencing 으로 확인 Comparison of 2-DE images for identified spots(Silver staining_150ug) CO Glucose CutC 추정 Mycobacterium sp. strain JC1 7월14일현재 matched 3 / A.A. cover 26% 7 pH4 : Silver staining에서 차이나는 spot : CBB staining에서 새로 확인된 차이나는 spot : 언제나 발현되는 spot
Chaperone protein dnaK (HSP 70) Mycobacterium paratuberculosis matched 7/ A.A. cover 22% HSP 65 Mycobacterium sp. graecum DL049 matched 6 / A.A. cover 19% MNO Mycobacterium sp. strain JC1 matched 13 / A.A. cover 41% probable atpD protein Mycobacterium tuberculosis matched 6/ A.A. cover 17% Unidentified spot Wag 31 M. tuberculosis strain H37RV matched 4 / A.A. cover 13% Wag 31 M. tuberculosis strain H37RV matched 4 / A.A. cover 13% 60 kDa chaperonin 2 Mycobacterium bovis matched 8/ A.A. cover 22% Glyceraldehyde-3-phosphate dehydrogenase Mycobacterium tuberculosis strain H37RV matched 4 / A.A. cover 26% CutB Mycobacterium sp. strain JC1 matched 8 / A.A. cover 44% FixB MALDI-TOF tandem mass및 N-terminal sequencing 으로 확인 FixA N-terminal sequencing 으로 확인 Comparison of 2-DE images by different staining methods CO (Silver staining –150ug) CO (CBB staining – 750ug) CutC 추정 Mycobacterium sp. strain JC1 7월14일현재 matched 3 / A.A. cover 26% 7 pH4 : Silver staining에서 차이나는 spot : CBB staining에서 새로 확인된 차이나는 spot : 언제나 발현되는 spot
Identified proteins with description : Silver staining에서 차이나는 spot : CBB staining에서 새로 확인된 차이나는 spot : 언제나 발현되는 spot
5180.4484 877.0496 824.2164 4907.3892 861.0737 1094.0636 3765.7449 893.0215 935.2601 2180.0553 1674.8578 2652.2839 2007.0797 1163.6024 1005.5742 1611.8029 1747.8719 2001.995 845.0954 1110.0350 1800.8221 2016.0297 2001.9873 1731.8694 1396.7046 1104.0308 1717.8981 1800.8308 1249.6476 1674.8445 1168.5708 1326.6753 1617.7537 855.0506 1277.1106 2497.2832 1595.4275 1562.89 883.0412 1327.1816 1554.805 908.9933 1754.9514 1396.6889 2002.9756 1696.8213 1168.5633 871.0245 2041.9521 1163.5844 2019.0006 1418.6812 1103.5942 854.0474 1554.7827 1005.5761 867.0579 1715.8633 870.0227 1940.9456 929.4628 2019.9901 2024.9868 866.4842 839.0791 2029.0680 847.4308 1731.8806 2382.1519 726.3304 847.1052 2180.0391 673.3515 2007.0580 1629.7988 578.3296 1816.8237 1627.8199 1412.6993 1692.8767 550.2653 847.4336 2037.9977 545.3293 866.0407 2023.9585 1088.0565 2040.9688 850.0656 1633.8199 899.0220 1828.9312 885.0461 2107.0498 1562.8970 2513.2676 881.0576 1985.9126 : : : : Protein identification - MNO CO Glucose JC1_MNO No. 11 11 Mass coverage : 57.69% A.A. coverage : 45.62%
I L I L S A G V A G G S D A A E V Protein identification – FixB CO Glucose 24 24 29 29 MALDI-TOF tandem mass spectrometry (ms/ms) of spot 24
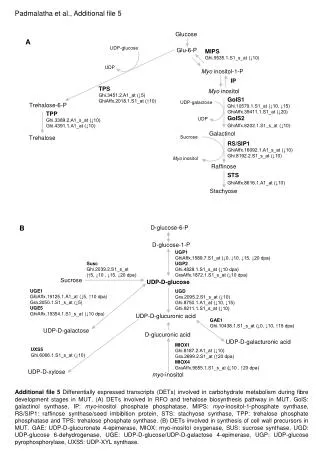
Alignment with tandem mass sequence of Spot 24 and FixB protein of other mycobacteria
Alignment with N-terminal sequence of Spot 24 and FixB protein of other mycobacteria : MALDI-tandem mass에서 확인된 sequence
Protein identification – FixA Alignment with N-terminal sequence of Spot 29 and FixA protein of other mycobacteria
31 CutB Spot31 5604.8243 1352.6488 1368.6412 3415.6467 1307.6918 3340.7373 3101.6404 1638.8818 1383.6991 2960.4597 1993.9966 1300.5671 1945.9366 1475.7728 2960.4316 1746.8843 3101.6233 1746.8998 1352.6303 1851.9434 1339.7357 1339.7328 1179.6062 2233.0786 1296.7157 1487.7643 1041.5941 1290.5743 861.0512 1277.7001 1039.5894 2150.0886 1036.5364 912.4421 2705.1604 1837.9597 662.3654 1614.7921 897.4163 517.3092 1296.7186 1079.5580 1395.6661 2048.0876 845.0720 1275.6168 2225.1248 1290.6100 2383.9502 1082.5626 1039.5979 863.0444 877.0383 : 2122.1340 : Protein identification – CutB CO Glucose Mass coverage : 57% 다만, unmatched major peaks가 많음 → 2개 이상의 단백질이 섞여 있음 A.A. coverage : 44%
40 CutC Spot40 3094.3373 998.6236 3070.3534 2284.1865 Trypsin peak 2263.0767 2093.0051 2092.0049 1669.8226 1669.8027 3324.6985 1013.5084 3337.7483 998.6145 881.2682 976.4880 2225.1682 789.4253 868.5119 642.3205 1106.5505 547.2358 1940.9419 1638.8492 2594.2505 2779.9241 3699.3474 : : Protein identification – CutC (미확정) CO Glucose Mass coverage : 27% Silver staining sample(150ug)이었으므로 Mass peak이 그다지 좋지 않음 → CutC일 가능성 有 (이기현data와 거의 동일함) A.A. coverage : 26%
Protein identification by Peptide mass fingerprinting (PMF) – HSP70, 60kDa chaperonin 2, HSP65, AtpD CO Glucose 1 1 5 5 6 6 7 7
21 21 21 Protein identification by Peptide mass fingerprinting (PMF) – GAPDH, Wag31 CO 19 silver staining_150ug CO 19 CBB-G staining_750ug Glucose 19 silver staining_150ug
DHAS Mycobacterium sp. strain JC1 matched 26 / A.A. cover 45% HSP 65 Mycobacterium sp. graecum DL049 matched 6 / A.A. cover 19% MNO Mycobacterium sp. strain JC1 matched 13 / A.A. cover 37% MNO Mycobacterium sp. strain JC1 matched 13 / A.A. cover 41% probable atpD protein Mycobacterium tuberculosis matched 6/ A.A. cover 17% Wag 31 M. tuberculosis strain H37RV matched 4 / A.A. cover 13% Wag 31 M. tuberculosis strain H37RV matched 3 / A.A. cover 13% 60 kDa chaperonin 2 Mycobacterium bovis matched 8/ A.A. cover 22% HPS Mycobacterium gastri N-terminal sequencing & PCR – 88% identity Glyceraldehyde-3-phosphate dehydrogenase Mycobacterium tuberculosis strain H37RV matched 4 / A.A. cover 27% Glyceraldehyde-3-phosphate dehydrogenase Mycobacterium tuberculosis strain H37RV matched 4 / A.A. cover 26% CutB Mycobacterium sp. strain JC1 matched 8 / A.A. cover 44% FixB MALDI-TOF tandem mass및 N-terminal sequencing 으로 확인 FixA N-terminal sequencing 으로 확인 Comparison of 2-DE images of CO and Methanol Chaperone protein dnaK (HSP 70) Mycobacterium paratuberculosis matched 7/ A.A. cover 22% CO (Silver staining –150ug) Methanol (Silver staining –150ug) FixB Mycobacterium leprae MALDI-TOF tandem mass로 확인 CutC 추정 Mycobacterium sp. strain JC1 7월14일현재 matched 3 / A.A. cover 26% 7 pH4 : Silver staining에서 차이나는 spot : CBB staining에서 새로 확인된 차이나는 spot : 언제나 발현되는 spot
Comparison of 2-DE images for un-identified spots(Silver staining_150ug) CO Glucose CutC ? 7 pH4
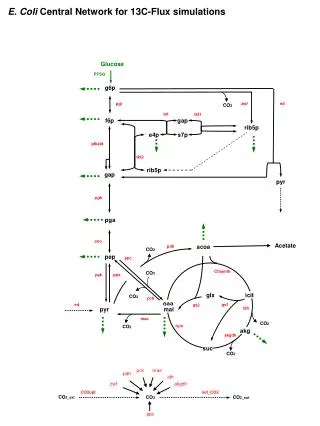
Comparison of 2-DE images for identified spots by 이기현 (CBB staining - 250ug) CO Glucose kDa 97 EF-Tu EF-Tu RNA P-α RNA P-α 66 45 CutB CutB 31 ASPK- α ASPK- α CutC CutC CbbS CbbS 22 10kDa GroES 10kDa GroES 14 7 7 4 4 : CO 조건에서 증가하는 spot : CO 조건에서 감소하는 spot
CutB Spot31 5604.8243 1352.6488 1368.6412 3415.6467 1307.6918 3340.7373 3101.6404 1638.8818 1383.6991 2960.4597 1993.9966 1300.5671 1945.9366 1475.7728 2960.4316 1746.8843 3101.6233 1746.8998 1352.6303 1851.9434 1339.7357 1339.7328 1179.6062 2233.0786 1296.7157 1487.7643 1041.5941 1290.5743 861.0512 1277.7001 1039.5894 2150.0886 1036.5364 912.4421 2705.1604 1837.9597 662.3654 1614.7921 897.4163 517.3092 1296.7186 1079.5580 1395.6661 2048.0876 845.0720 1275.6168 2225.1248 1290.6100 2383.9502 1082.5626 1039.5979 863.0444 877.0383 : 2122.1340 : CutB mass data 비교
CutC Spot40 3094.3373 998.6236 3070.3534 2284.1865 2263.0767 2093.0051 2092.0049 1669.8226 1669.8027 3324.6985 1013.5084 3337.7483 998.6145 881.2682 976.4880 2225.1682 789.4253 868.5119 642.3205 1106.5505 547.2358 1940.9419 1638.8492 2594.2505 2779.9241 3699.3474 : : CutCmass data 비교 Trypsin peak