Download
1 / 55
550 likes | 786 Views
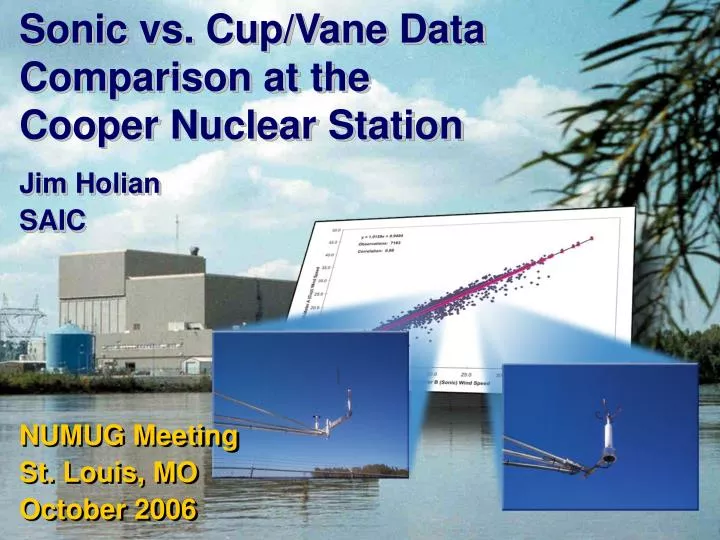
Sonic vs. Cup/Vane Data Comparison at the Cooper Nuclear Station. Jim Holian SAIC. NUMUG Meeting St. Louis, MO October 2006. CNS Meteorological System. Upgraded 100-meter tower in 2004 to include a dual elevator on the same tower face

E N D
Sonic vs. Cup/Vane Data Comparison at the Cooper Nuclear Station Jim Holian SAIC NUMUG Meeting St. Louis, MO October 2006
CNS Meteorological System • Upgraded 100-meter tower in 2004 to include a dual elevator on the same tower face • Dual monitoring systems with independence from sensor to Plant Computer • Wind Sensors have Cups/Vanes on one side and Sonic on the other
Meteorological Parameters Systems A and B • 10, 60, and 100 meter wind speed and direction • 3 Delta-ts (60m-10m, 100m-10m, 100m-60m) • 10, 60, and 100 meter temperatures System A only • 10 meter dew point • Station Pressure • Precipitation
Meteorological Equipment System A • Climatronics F460 Wind speed and Direction Sensors • Climatronics Temperature Sensors • Tower Systems Elevator • Climatronics Dew Point Sensor • Climatronics Tipping Bucket Rain gauge with Wind Shield • Campbell Scientific 23X Micro Dataloggers • Climatronics Pressure Sensor
Meteorological Equipment System B • Met One 50.5 Sonic Wind speed and Direction Sensors • Climatronics Temperature Sensors • Tower Systems Elevator • Campbell Scientific 23X Micro Dataloggers
Purpose • Independently verify wind data collected from both systems are not statistically different • Data from System A (cup/vane) can be interchanged with data from System B (sonic) • Demonstrate the impact of the tower structure on meteorological data
Data Set • One year of onsite validated hourly meteorological data (October 31, 2004 – October 30, 2005) • 8784 possible hourly values for each parameter for both Systems A and B on the 100-meter tower
Methodology • Remove bad data from System A and System B files including calibrations, frozen sensors, failed sensors, bad data spikes, etc • Remove wind directions when wind speeds less than 3 mph and/or wind directions are through tower • Remove wind speeds when wind directions are through tower
Table 3–1 Invalid Data for CNS Onsite Meteorological ProgramOctober 31, 2004 – October 30, 2005
Wind Directions from 195-245 degrees blow through tower • Window is 25 degrees for vane and cup sensors and 30 degrees for sonic sensor
Data Availability • 100- meter wind speed 82% • 60-meter wind speed 87% • 10-meter wind speed 88% • 100-meter wind direction 84% • 60-meter wind direction 45% • 10-meter wind direction 70%
Results Unobstructed with no tower influence
Tower Impacts Wind Speed and Direction
Wind Directions from 195-245 degrees blow through tower • Window is 25 degrees for vane and cup sensors and 30 degrees for sonic sensor