Download
1 / 33
360 likes | 566 Views
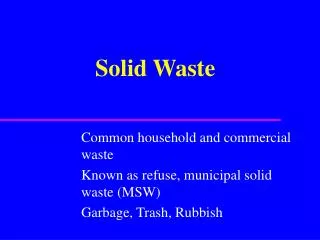
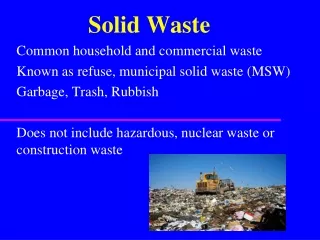
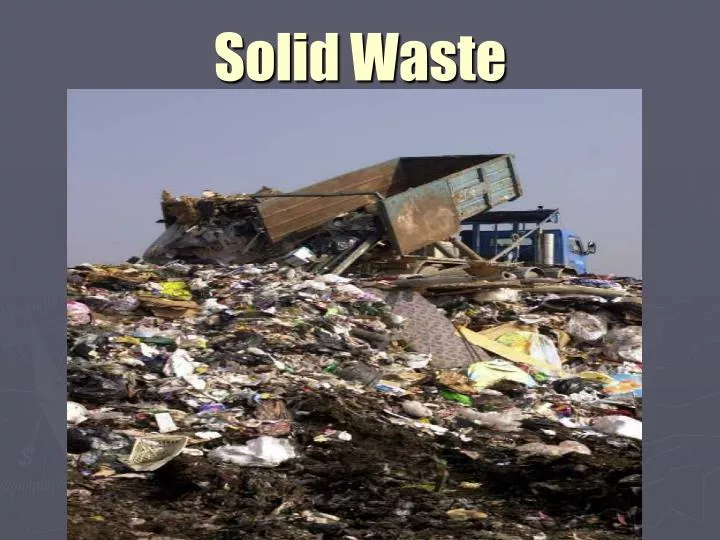
Solid Waste. Solid Waste. Unwanted/discarded material, not liquid or gas Sources: Sludge from water treatment, industry Commercial & Industrial byproducts Construction Municipal garbage An underutilized resource A mirror of society “Cradle to Grave” production philosophy.

E N D
Solid Waste • Unwanted/discarded material, not liquid or gas • Sources: • Sludge from water treatment, industry • Commercial & Industrial byproducts • Construction • Municipal garbage • An underutilized resource • A mirror of society • “Cradle to Grave” production philosophy
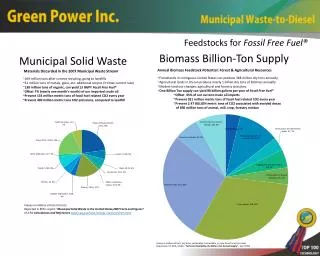
Natural Capital Degradation • U.S. produces 1/3 of worlds solid waste • 12 billion tons of solid waste produced in the United States each year from: • 75% Mining, oil, and gas production • 13% Agriculture • 9.5% Industry • 1.5% Municipal (MSW) • 1% Sewage Sludge
Paper is about 38% of MSW Yard waste – 12% Food waste – 11% Plastics - 10% Fastest growing problem is ‘e-waste’ or from electronic devices Where does it come from?
Pollution, Waste and Environmental Disturbances Natural Resources Goods and Services
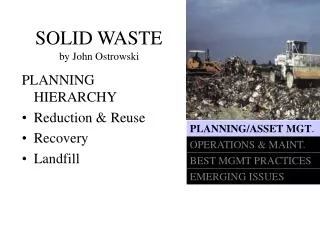
Option - Waste Management Accept high-waste society as unavoidable because of economic growth Reduce environmental harm; bury, burn or compress it Transfer from one environment to another P2 – Pollution Prevention
Exporting Wastes • Between Countries • Between States • New York (3,774,000 tons) -> PA, VA, OH, CT <- VT, MA (0.16 mil tons) • Illinois (2,800,000 tons) -> IN, WI <- MO, IA, IN, WI (1.3 mil. tons) • California (453,183 tons) -> NV, WA
Problem: Rise of Interstate Garbage Commerce • 1993: 14.45 million tons of municipal solid waste crossed state lines • 2003: 39 million tons • Causes: • Increased generation • Geographic distribution of landfill • Capacity limits • Consolidation of waste management industry
Interstate Commerce - Garbage Stakeholders • Biggest Garbage Exporters • New York, New Jersey, Missouri, Maryland, Massachusetts • Biggest Garbage Importers: • Pennsylvania, Virginia, Michigan, Illinois, Indiana • Waste Management Companies: • Three companies gross 67% of the revenue earned for U.S. municipal solid waste management
Environmental Concerns • Diesel exhaust – air pollution • Human health concerns • Environmental impacts • CO2 emissions– global warming • Highway congestion • Increase in accidents • Increase in spills • Inter-coastal transport – water pollution, spills
P2 con’t. • Option - Waste Reduction • Low waste approach • Reduce consumption • Redesign products • Eliminate or reduce packaging • Recycle, Reduce • View waste as a resource • Encourage reduction and prevention (economically & legislatively) • Conserves matter (resources) and energy • Reduces pollution, ecological benefits • Can be economically beneficial
SOLUTIONS - Sustainability • Consume less • Redesign manufacturing processes and products to use less • Redesign industrial processes to produce less waste and pollution • Develop products that are easy to repair, reuse, remanufacture, compost or recycle • Design products that last longer • Eliminate or reduce unnecessary packaging • “Cradle to Cradle” philosophy
Reduce Use of Natural Resources Recover Technical Nutrients
Ecoindustrial Revolution • ‘Biomimicry’ mimic natural environment – matter is recycled • Resource Exchange between industries • Redevelop ‘brown fields’ • Success stories – 3M: reduced waste by 30% • Redesigned equipment and processes • Used fewer hazardous chemicals • Recycled more hazardous pollutants
Compare to material-flow economy Eco-leasing: Xerox Air conditioning Carpets & tile cameras Service-flow Economy
Reuse Advantages Used in developing countries – saves $ E-Products used in developed countries dismantled and re-used where labor is cheap Drinks in reusable containers cost less (PET plastics); saves energy Cloth shopping bags instead of plastic Industrial packaging Disadvantages Potential health risks when reusing food or water containers Pollution and health risks from Pb, Hg, Cd, dioxin Companies make more money selling disposable containers Less convenient Need economic incentives and redesign Reuse or Throw-away Society?
Recycling • Preconsumer vs. postconsumer • Municipal Possibilities • Paper • Glass • Aluminum • Steel • Plastics • US MSW recycling • Currently - 30% • Future - up to 60-80%
Primary or closed Loop Secondary recycling or down cycling (tires to surfacing materials) Recylcing
Recycling Benefits • Reduce solid waste • Reduce pollution: air, water, soil • Saves energy (harvesting virgin resources) • Reduce habitat destruction • Species protection • Saves money (tire disposal site on fire)
Recycling Disadvantages • Source separation • Technology • Cost? • Space
Composting • Reduce paper, yard, and vegetable waste • Currently, composting 5% in the US • Potential – 35% • Useful as fertilizer, topsoil, or landfill cover
Why is the US behind in reuse and recycling? • Market price of products do not include environmental costs • Resource-extracting industries receive more tax breaks and subsidies than recycling and reuse industries • Still cheaper here to use landfills. • Demand and prices for recycled materials fluctuates
How can we encourage recycling and reuse? • Increase subsidies and tax breaks for industries choosing recycled resources over virgin resources • PAUT: pay as you throw • Product stewardship – industry responsibility for take back of products (e-waste) • Phase out use of hazardous materials when possible
Sanitary Landfills • Advantages • Little odor • water pollution • Quick and easy to build • Low operating costs • Disadvantages • Noise and traffic • Dust • Air pollution • Greehouse gases (methane and CO2) • Water pollution
Incineration • Advantages • Reduce trash volume • Lowers need for landfills • Lower water pollution • Easy • Disadvantages • High cost • Air pollution (dioxins) • Produces toxic ash • Discourages recycling
Hazardous Waste • RCRA – Resource Conservation and Recovery Act, regulates 5% of hazardous waste • Not regulated by RCRA: • Radioactive waste • Household waste • Mining wastes • Oil and gas drilling • Liquid waste • Small business
How? Physical methods Chemical reactions Bioremediation Phytoremediation Plasma Where do they go? Incineration Deep well injection Surface impoundments Secure landfills NIMBY Detoxifying Hazardous Waste
Brownfields • Abandoned industrial sites or other hazardous waste sites that are cleaned up and put to use • Include: old landfills, munitions dumps, shooting ranges, ode factories • Require: remediation, soil reclamation
Chemical Toxins – Heavy Metals • Lead • Children inhale or ingest • Banned leaded gas • Still found in paint chips from homes build prior to 1960 • Mercury • Inhale or ingest in fish • From burning coal and incineration • Bioaccumulation and maginification
Chemical Toxins - Dioxins • Chlorinated hydrocarbons • Sources: • 70% from incineration of MSW & medical waste • Smelting, refining • Forest fires • Toxicity: • Persistent • Carcinogenic – TCDD • HAAS • Human exposure from food
Hazardous Waste Regulation • RCRA – Resource Conservation and Recovery Act • EPA identify hazardous waste and set standards • Industry permits for managing • Develop ‘cradle to grave’ system, generation to disposal • CERCLA – Superfund • Identify abandoned sites • Protect and/or clean up ground water • Identify sites for NPL – National Priorities List for remediation • Who pays? Polluter or Taxpayer