Download
1 / 16
160 likes | 168 Views
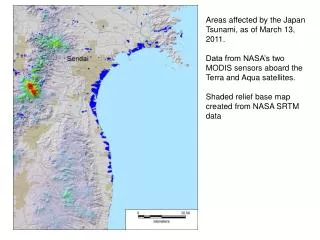
Areas affected by the Japan Tsunami, as of March 13, 2011. Data from NASA’s two MODIS sensors aboard the Terra and Aqua satellites. Shaded relief base map created from NASA SRTM data. Detail of area east of Sendai, with ASTER topography, and MODIS tsunami extent in dark blue.

E N D
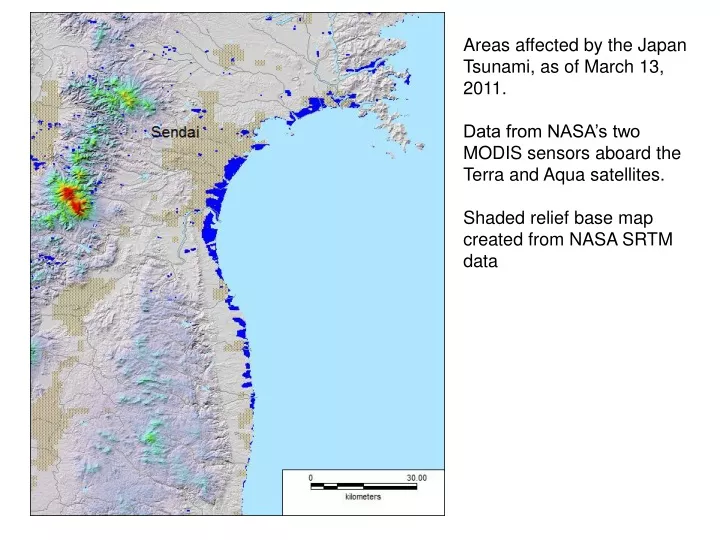
Areas affected by the Japan Tsunami, as of March 13, 2011. Data from NASA’s two MODIS sensors aboard the Terra and Aqua satellites. Shaded relief base map created from NASA SRTM data
Detail of area east of Sendai, with ASTER topography, and MODIS tsunami extent in dark blue
Sample of before and after MODIS data. Red asterisks mark location of large scale tsunami flooding.
August 24, 2010 (left) March 13, 2011 (right)
August 24, 2010 (left) March 13, 2011 (right)
August 24, 2010
March 13, 2011
Validation of MODIS results with TerraSar-X Part 1 Change detection analysis based on two TerraSAR-X radar satellite images acquired on October 20, 2010, pre-disaster, and March 12, 2011, post-disaster. Flooded areas after the tsunami are shown in blue. Unchanged water bodies as well as airport runways or major roads are shown in black. Image analysis performed by DLR IMF/DFD. Spatial resolution of this map not provided in the legend. However, TerraSAR-X commonly provides images showing features as small as 1 m. Process used to geocode this information not given in legend; map accuracy not known.
Validation of MODIS results with TerraSar-X Part 2 • MODIS inundation extent outline (GIS format) superimposed on TerraSAR-X image map as red outline. • MODIS data are coarser spatial resolution (250 m) but automatically geocoded to +/- 50 m positional accuracy. • The two techniques are complementary: • MODIS covers much wider area, and GIS vector data can be generated immediately by coupling automated water classification techniques to GIS output. • TerraSAR-X provides much better spatial detail, but automated water classification to GIS processing is not yet developed. Change detection using before and after images is commonly needed for good results. Area covered is much smaller per image. Manual geocoding is commonly necessary and is labor intensive.
Detailed view comparing the MODIS GIS inundation extent outline (red outline) with the TerraSAR-X change detection product (blue color and hand-drawn white dashed outline).
March 13 MODIS data imported into GoogleEarth, north to south. Scene 1
March 13 MODIS data imported into GoogleEarth, north to south. Scene 2
March 13 MODIS data imported into GoogleEarth, north to south. Scene 3
March 13 MODIS data imported into GoogleEarth, north to south. Scene 4
March 13 MODIS data imported into GoogleEarth, north to south. Scene 5 (closer view of airport in Scene 4)
March 13 MODIS data imported into GoogleEarth, north to south. Scene 6