Download
1 / 15
150 likes | 250 Views
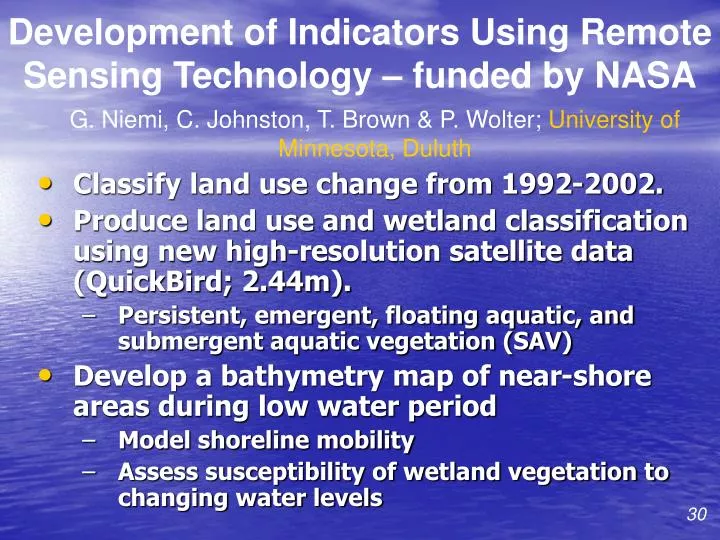
Development of Indicators Using Remote Sensing Technology – funded by NASA. G. Niemi, C. Johnston, T. Brown & P. Wolter; University of Minnesota, Duluth. Classify land use change from 1992-2002.

E N D
Development of Indicators Using Remote Sensing Technology – funded by NASA G. Niemi, C. Johnston, T. Brown & P. Wolter; University of Minnesota, Duluth • Classify land use change from 1992-2002. • Produce land use and wetland classification using new high-resolution satellite data (QuickBird; 2.44m). • Persistent, emergent, floating aquatic, and submergent aquatic vegetation (SAV) • Develop a bathymetry map of near-shore areas during low water period • Model shoreline mobility • Assess susceptibility of wetland vegetation to changing water levels 30
Sample of the multi-temporal Landsat classification literature as of 1991 • Kalensky 1974 “could improve results” • Kalensky and Scherk 1975 “multi-date is best” • Kan and Weber 1978 “no clear benefit” • Beaubien 1979 “provides better contrast” • Walsh 1980 “September better than June” • Nelson 1984 “avoid senescent imagery” • Toll 1985 “not significantly better” • Schriever and Congalton 1991 “more efficient”
Layered Classification Approach Using Vegetation Indicies (NDVI) and Image Differencing
jack pine jack pine - hardwood jack pine - oak red pine red pine - hardwood spruce-fir spruce-fir - hardwood cedar cedar - hardwood tamarack black spruce acid bog conifer, stagnant conifer, regeneration black ash black ash - conifer black ash - conifer under. hardwoods, misc. (lowland) aspen-birch aspen-birch - conifer aspen-birch - conifer under. northern hardwoods northern hardwoods - conifer northern hwd, con. under. red oak pin oak oak - pine hardwood, regeneration water emergent, aquatic emergent Sphagnum spp. agriculture grass, native grass, native (lowland) grass, cool season grass, domestic brush, alder brush, alder (lowland) brush, willow brush, willow (lowland) brush, misc. brush, misc. (lowland) brush, ericacious developed
National Land Cover Dataset (NLCD) Our Processing Steps • Stratify Landsat-7 with NLCD • Classify using phenology • Age structure by species • Change analysis • Develop landscape indicators The USGS, in cooperation with the EPA, has produced a land cover dataset for the conterminous United States on the basis of 1992 Landsat thematic mapper imagery and supplemental data. The NLCD is a component of the USGS Land Cover Characterization Program.
Landscape Indicators • Wetland acreage losses or gains • Area of land paved or permanently covered • Wetland size, abundance • Aerial extent of wetland types • Nature and extent of riparian vegetation • Exotic species • Land use adjacent to coastal wetlands • Urban density • Farmland as a percentage of total land • Number of wetlands per unit area • Area of forest cut 31
2 October 2001 Level = 577.5 ft.
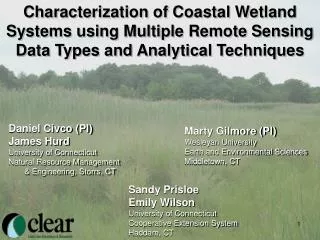
Little Tail Point Green Bay 34
Wet Meadow Nuphar advena Typha latifolia Phragmites australis
2 October 2001 Level = 577.5 ft. 15 July 1997 Level = 581.3 ft. March 1964 Level = 576.1 ft. October 1986 Level = 583.4 ft. 6 September 1999 Level = 578.4 ft.
Some of the indicators we hope to derive: • Area of land paved • Area of forest permanently lost to development • Urban density and rate of change • Loss/gain of wetlands • Percent change in land use type • Area of redeveloped brown fields • Loss/gain of forested land • Percent cropland by area and change through time • Area of cropland within 1, 5, and 10 Km or a shoreline • Area of cropland near waterways on slopes • Proportion of various land use/cover types in the basin • Coastal wetland size, abundance and susceptibility to high water threats • Nature and extent of riparian vegetation
Visit our website http://glei.nrri.umn.edu