Download
1 / 13
130 likes | 258 Views
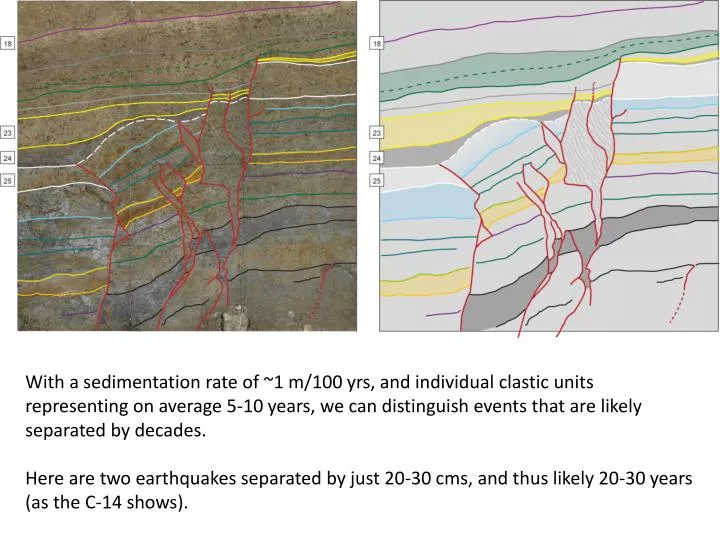
With a sedimentation rate of ~1 m/100 yrs, and individual clastic units representing on average 5-10 years, we can distinguish events that are likely separated by decades. Here are two earthquakes separated by just 20-30 cms , and thus likely 20-30 years (as the C-14 shows).

E N D
With a sedimentation rate of ~1 m/100 yrs, and individual clastic units representing on average 5-10 years, we can distinguish events that are likely separated by decades. Here are two earthquakes separated by just 20-30 cms, and thus likely 20-30 years (as the C-14 shows).
Composite Stratigraphic Column modern BSSA: Biasi, 2002; Fumal, 2002; Scharer, 2007 Young Section 1500 B.C. 12 meters 44 clastic layers 15 earthquakes Old Section 4 meters 44 clastic layers 14 earthquakes 1500 A.D. 3000 B.C. Middle Section
Dated Interpolated Young Section 12 yr 236 yr Sedimentation Event Return Interval Cumulative Frequency 37 yr Earthquakes 2 cm/yr Clastic Accumulation Rate (cm/yr) Cumulative Thickness (cm) 0.6 cm/yr 0.4 cm/yr Calendar Year (A.D.)
Starting w/ W13 Age of debris flow layer is age of underlying peat.
Of the 111 UCERF-2 slip rates we can associate with USGS Quaternary Faults Database slip rate categories, 96 UCERF rates fall in the consistent USGS category, 6 UCERF rates are too high, and 9 UCERF rates are too low. • We need to check the 15 that are not consistent and do some work to associate the rest of the UCERF rates with their USGS categories so we can check their consistency. • We can use the USGS Quaternary Faults Database to assign slip rate categories to UCERF faults that we don’t have slip rates for.