Download
1 / 22
220 likes | 322 Views
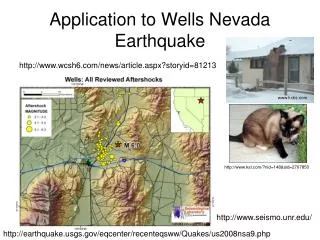
Application of HAZUS TM to the New Madrid Earthquake Project. Prepared for: Federal Emergency Management Agency Central US Earthquake Consortium Prepared by: Risk Management Solutions, Inc. Michael Baker Corporation. Presentation Overview. Study Region Overview and Characteristics

E N D
Application of HAZUSTM to the New Madrid Earthquake Project Prepared for: Federal Emergency Management Agency Central US Earthquake Consortium Prepared by: Risk Management Solutions, Inc. Michael Baker Corporation
Presentation Overview • Study Region Overview and Characteristics • HAZUS Level 1/2 Analysis for M6.5 earthquake • Results for 6 functional areas of the New Madrid Earthquake Project: • Health and medical services plan and implementation capability • Transportation plan and implementation strategy • Housing recovery strategy • Emergency management assistance compact • Post-disaster building inspection capability • HAZUS applications
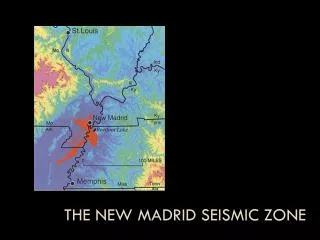
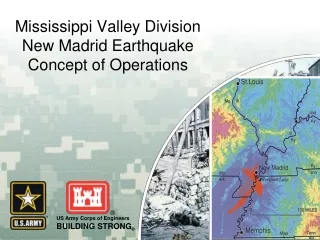
5 States 40 Counties 461 Census Tracts 23,000 sq. mi. Study Region Overview and Characteristics Greater Memphis Area
Study Region Overview and Characteristics Population Density • Population: 1.9 Million • Households: 700,000 Number of Residences (by distance from epicenter) Within 25 mi. :273,000 25 to 50 mi. : 78,500 50 to 75 mi. :164,000 Over 75 mi. : 91,000
Study Region Overview and Characteristics Essential Facilities Inventory 5-State Region • Elementary/High Schools: 816 • College/ Universities: 62 • Large Hospitals: 20 • Medium Hospitals: 31 • Small Hospitals: 10
Study Region Overview and Characteristics Emergency Response Inventory 5-State Region • Emergency Operations Centers: 28 • Fire Stations: 214 • Police Stations: 200
Study Region Overview and Characteristics Transportation Exposure 5-State Region • Highways: • 7,800 Miles • $126 Billion Value • Bridges: • 3,660 Simply Supported • 490 Continuous • 250 Major • $11 Billion Value • Aircraft Facilities: • 93 Airports • 9 Heliports • $763 Million Value
Study Region Overview and Characteristics Utility Exposure 5-State Region • Potable Water: • 76 Facilities • 5,900 mi. of Pipe • $3.7 Billion Value • Waste Water: • 4 Major Facilities • $1.1 Billion Value • Electrical Power: • 5 Major Plants • $2.2 Billion Value
Study Region Overview and Characteristics General Building Stock Exposure (by distance from source, $Millions) Residential: Commercial: Industrial: Total: Within 40 mi. Over 40 mi. $34,400 $25,800 $ 8,500 $ 4,300 $ 2,400 $ 2,100 $46,900 $33,300 Total Building Stock Exposure: $80.2 Billion
Study Region Overview and Characteristics Ground Shaking Intensity 5-State Region • Magnitude 6.5 in Downtown Memphis (35.1N 90.0W) • Project 97 East Coast Attenuation • Max. PGA = 0.95g
Health and Medical Services Plan andImplementation Capability Hazardous Materials Sites and Ground Shaking Intensity 5-State Region • Number of HAZMAT Sites by Shaking Intensity • Light: 54 • Moderate: 238 • Considerable: 221 • Strong: 82 • Severe: 81 • Violent: 240
Health and Medical Services Plan andImplementation Capability Nighttime Injuries vs. Hospital Functionality 5-State Region • Number of Nighttime Injuries by Severity Basic Medical Aid: 2,810 Non-Life Threatening: 480 Life Threatening: 84 Fatal: 50
Transportation Plan and Implementation Strategy Emergency Route Planning: Population vs. Route Capacity Greater Memphis Region • Approx. 800,000 nighttime residents plus emergency personnel • 50,000 vehicles/day average capacity for 430 area bridges
Transportation Plan and Implementation Strategy Emergency Route Planning: Scenario Impact on Bridges Greater Memphis Region • Approx 15% of Bridges Operational • 10 Operational • 47 Operational w/ Damage • 16 Restored w/in 30 Days • 365 Restored after 30 Days • Surface Streets most viable Alternate Routes • Majority of 5-State Region Bridges are Undamaged
Housing Recovery Strategy Displaced Households and Shelter Locations 5-State Region • Displaced Households: 11,667 • Shelter Locations (Schools) • Available: 549 • Unavailable: 329 • Nearest Available School is 15 mi. from Epicenter
Housing Recovery Strategy Households without Water or Power 5-State Region • Total Households:700,000 • Households Without Water:320,000 • Households Without Power:469,000
Emergency Management Assistance Compact Functionality: Emergency Response, Aircraft and Communications Facilities Emergency Response Communications Aircraft Facilities
Post-Disaster Building Inspection Capability Projected No. of Yellow Tagged Structures 5-State Region • Total Structures: 625,000 • Yellow Tags: 107,000 (17%) • Yellow Tags - Moderately to Extensively Damaged, Limited Access
Post-Disaster Building Inspection Capability Projected No. of Red Tagged Structures 5-State Region • Total Structures: 625,000 • Red Tags: 25,000 (4%) • Red Tags - Extensive to Completely Damaged, Access Prohibited
Post-Disaster Building Inspection Capability Estimated Amount of Debris Generated 5-State Region • Total:4.7 Million tons • Brick/Wood:2.5 Million tons • Steel/Concrete:2.2 Million tons • Max. Debris in a Single Tract:130,000 tons
HAZUS Applications General Building Stock Losses (by distance from source, $Millions) Residential: Commercial: Industrial: Total: Within 40 mi.Over 40 mi. $ 7,400 (21%) $120 $ 5,000 (58%) $ 70 $ 320 (13%) $ 10 $13,800 (29%) $230 Total Building Stock Loss: $14 Billion (17%)
HAZUS Applications Dam Inundation Potential 5-State Region • Number of Dams:953 • Number of High1 Hazard Dams by Shaking Intensity: • Light: 7 • Moderate: 45 • Considerable: 18 • Strong: 16 • Severe: 19 • Violent: 5 1USACE Hazard Classification