Download
1 / 11
110 likes | 180 Views
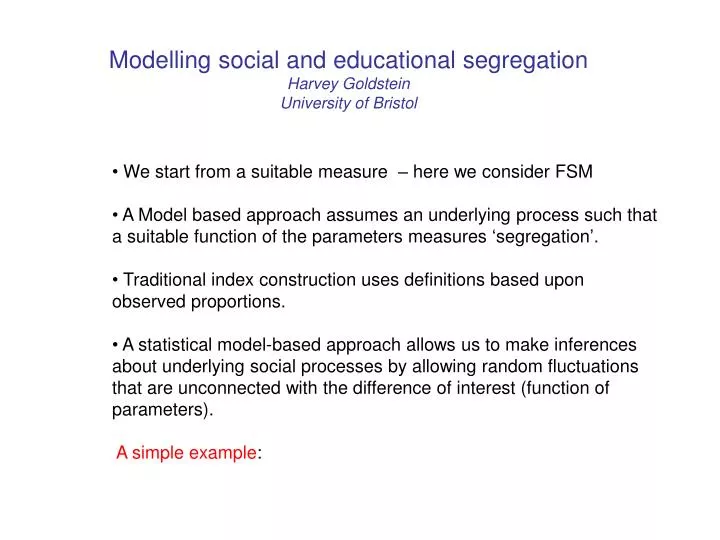
Modelling social and educational segregation Harvey Goldstein University of Bristol. We start from a suitable measure – here we consider FSM A Model based approach assumes an underlying process such that a suitable function of the parameters measures ‘segregation’.

E N D
Modelling social and educational segregationHarvey GoldsteinUniversity of Bristol • We start from a suitable measure – here we consider FSM • A Model based approach assumes an underlying process such that a suitable function of the parameters measures ‘segregation’. • Traditional index construction uses definitions based upon observed proportions. • A statistical model-based approach allows us to make inferences about underlying social processes by allowing random fluctuations that are unconnected with the difference of interest (function of parameters). • A simple example:
Suppose we have 2 schools with same number of students (or same school at 2 time points) and supppose that underlying proportion FSM does not change but random fluctuations will produce actual proportions that differ (with binomial variation). A natural segregation measure is Butwhere is the underlying proportion, N is number in each school. For example, we have following values for the mean value of this index for a range of values of , N.
A multilevel model for measuring segregation • A basic model consists of the proportion FSM as the response, with predictors such as school type or ‘year’ and an ‘effect’ for each school that is treated as a Normally distributed random variable. • Thus, we can have a model where each year intake cohort is allowed to have its own (Normal) variance and the changes in these variances then are interpreted as changes in segregation. If the model ‘fits’ well the variance is an appropriate measure of variation and can then be interpreted as a measure of segregation • The next slide shows that the (logit) proportions are close to a Normal distribution
We see that this distribution is close to Normal and this is confirmed by an analysis of residuals. Results follow. Note that we do not have intake year data, only for whole school, so successive years overlap.
1999 selective 1994 selective 1999 not selective 1994 not selective
Conclusions • A modelling approach is the only appropriate one if we wish to make social science generalisations • The model has to be multilevel to take account of the structure of the educational system • We can incorporate cross classifications and any number of predictors if needed.
References • Allen, R. and Vignoles, A. (2006). What should an index of school segregation measure? London, Institute of Education. • Hutchens, R. (2004). One measure of segregation. International Economic Review45: 555-578. • Goldstein, H. and Noden, P. (2003). Modelling social segregation. Oxford Review of Education29: 225-237 • Gorard, S. (2000). Education and Social Justice. Cardiff, University of Wales Press.