Download
1 / 72
750 likes | 983 Views
HOMOGENITY AND HOMOGENIZATION METHODS. A review. Enric Aguilar Climate Change Research Group Geography Department Universitat Rovira i Virgili de Tarragona (Spain). enric.aguilar@urv.cat. OUTLINE. A few questions to start What does homogeneous (and inhomogeneous) mean?

E N D
HOMOGENITY AND HOMOGENIZATION METHODS. A review. Enric Aguilar Climate Change Research Group Geography Department Universitat Rovira i Virgili de Tarragona (Spain) enric.aguilar@urv.cat SUMMER SCHOOL ON THE PREPARATION OF CLIMATE ATLAS Sitke (Hungary); 10 - 14 September 2007
OUTLINE • A few questions to start • What does homogeneous (and inhomogeneous) mean? • Why a time series may become inhomogeneous • What does homogeneity assessment mean? • What does homogenization mean? • How does the lack of homogeneity compromise climate analysis? • Some general procedrures for homogeneity assessment and homogenization • A brief review of techniques. Will briefly introduce these methods (not necessarily in this order) • Craddock + Metadata • Likelihood ratio: SNHT • Regression models • Two-phase regression • Caussinus-Mestre • Vincent’s interpolation of daily factors • Della Marta and Wanner • The HOME-COST Action SUMMER SCHOOL ON THE PREPARATION OF CLIMATE ATLAS Sitke (Hungary); 10 - 14 September 2007
A FEW QUESTIONS TO START • What does homogeneous mean? • From. lat. homogenĕus, and from gr. ὁμογενής “of the same nature” • Translating the term to climate time series: • A homogeneous climate time series is defined as one where variations are caused only by variations in climate. If a long-term time series is homogeneous, then all variability and change is due to the behavior of the climate system (WMO TD-1186) • Conversely, inhomogeneous time series are those presenting any kind of bias, which impacts the recorded values and is not strictly caused by true climatic variability and change SUMMER SCHOOL ON THE PREPARATION OF CLIMATE ATLAS Sitke (Hungary); 10 - 14 September 2007
A FEW QUESTIONS TO START • Why a time series may become inhomogeneous? • Because a change has been applied or an error has been introduced into the conditions the data are measured, recorded, transmitted, stored and or analyzed resulting in a systematic bias of a particular segment of the time series SUMMER SCHOOL ON THE PREPARATION OF CLIMATE ATLAS Sitke (Hungary); 10 - 14 September 2007
A FEW QUESTIONS TO START • Why a time series may become inhomogeneous?. Example I: errors in temperature units leading to an artificial change in variance SUMMER SCHOOL ON THE PREPARATION OF CLIMATE ATLAS Sitke (Hungary); 10 - 14 September 2007
A FEW QUESTIONS TO START • Why a time series may become inhomogeneous?. Example II: change of rain gauge exposure, leading to an artificial bias in precipitation amount SUMMER SCHOOL ON THE PREPARATION OF CLIMATE ATLAS Sitke (Hungary); 10 - 14 September 2007
A FEW QUESTIONS TO START • Why a time series may become inhomogeneous?. Example III: changes in the way of computing the daily mean temperature, leading to important biases when compared to WMO standard (max+min)/2 SUMMER SCHOOL ON THE PREPARATION OF CLIMATE ATLAS Sitke (Hungary); 10 - 14 September 2007
A FEW QUESTIONS TO START • Why a time series may become inhomogeneous?. Example IV: impact of urbanization on temperature series, leading to an artificial enhancement of trends SUMMER SCHOOL ON THE PREPARATION OF CLIMATE ATLAS Sitke (Hungary); 10 - 14 September 2007
A FEW QUESTIONS TO START • Why a time series may become inhomogeneous?. Example V: instrument replacement, leading to an artificial bias (jump) on radiation series SUMMER SCHOOL ON THE PREPARATION OF CLIMATE ATLAS Sitke (Hungary); 10 - 14 September 2007
A FEW QUESTIONS TO START • Why a time series may become inhomogeneous?. Example VI: impact of relocations and changes in environment on wind speed time series SUMMER SCHOOL ON THE PREPARATION OF CLIMATE ATLAS Sitke (Hungary); 10 - 14 September 2007
A FEW QUESTIONS TO START • Why a time series may become inhomogeneous?. Example VII: changes in screen type, leading to an artificial bias in temperature Differences between Simoultaneous temperatures measured in Murcia (Spain). Lines are Stevenson – Montsouris screen. Red is Tmax (much larger temperatures in Montsouris screen lead to negative differences); blue is Tmin (slightly larger values in stevenson screen lead to positive differences); green is Tmean, which balances the effect of Tmax and Tmin into negative differences (i.e. larger temperatures registerd on ancient screens) SUMMER SCHOOL ON THE PREPARATION OF CLIMATE ATLAS Sitke (Hungary); 10 - 14 September 2007
A FEW QUESTIONS TO START • What does homogeneity assessment mean? • To learn if a time series is or is not homogeneous (I) Peterson et al, 2002 Aguilar et al, 2005 SUMMER SCHOOL ON THE PREPARATION OF CLIMATE ATLAS Sitke (Hungary); 10 - 14 September 2007
A FEW QUESTIONS TO START • What does homogeneity assessment mean? • To learn if a time series is or is not homogeneous (II) Quebec – reference series Source: Lucie Vincent SUMMER SCHOOL ON THE PREPARATION OF CLIMATE ATLAS Sitke (Hungary); 10 - 14 September 2007
A FEW QUESTIONS TO START • What does homogenization mean?Apply statistical techniques to transform a) into b) and try to eliminate as much as possible non climatic influences biasing the time series a) Quebec City, 1895-2002 (Non adjusted) b) Quebec City, 1895-2002 (Non adjusted) Source: Lucie Vincent. SUMMER SCHOOL ON THE PREPARATION OF CLIMATE ATLAS Sitke (Hungary); 10 - 14 September 2007
A FEW QUESTIONS TO START • How does the lack of homogeneity compromise climate analysis? Quebec City, 1895-2002 Trend before homogenization: -0.7°C in 106 years Source: Lucie Vincent. SUMMER SCHOOL ON THE PREPARATION OF CLIMATE ATLAS Sitke (Hungary); 10 - 14 September 2007
A FEW QUESTIONS TO START • How does the lack of homogeneity compromise climate analysis? Quebec City, 1895-2002 Trend after homogenization: +2.1 °C in 106 years Source: Lucie Vincent. SUMMER SCHOOL ON THE PREPARATION OF CLIMATE ATLAS Sitke (Hungary); 10 - 14 September 2007
SOME GENERAL QUESTIONS Use Quality Controlled Data Detect inhomogeneities(in other words, identify homogeneous subperiods) Adjust to the last homogeneous subperiod Validate results SUMMER SCHOOL ON THE PREPARATION OF CLIMATE ATLAS Sitke (Hungary); 10 - 14 September 2007
A GENERAL PROCEDURE FOR HOMOGENEITY ASSESSMENT AND HOMOGENIZATION Metadata Detect inhomogeneities(in other words, identify homogeneous subperiods) Visual inspection Test SUMMER SCHOOL ON THE PREPARATION OF CLIMATE ATLAS Sitke (Hungary); 10 - 14 September 2007
SOME GENERAL QUESTIONS Over the data? Test Climate fluctuations may be confused with inhomogeneities • Identify if period A is different from period B (good when you have reliable metadata) • Identify in which data point the time series is most likely to have breakpoint • Iterate over the series or use a model that allows multiple breaks detection Using reference series? Using a model based on a reference series or running the test with the help of a reference series should help to distinguish climate effects from true inhomogeneities SUMMER SCHOOL ON THE PREPARATION OF CLIMATE ATLAS Sitke (Hungary); 10 - 14 September 2007
ON THE USE OF REFERENCE SERIES • Decorrelation (network density) • Homogeneity of the reference series Using reference series? - Specially problematic at early stages (i.e. 19th century), due the lack of data Auer et al, 2005 SUMMER SCHOOL ON THE PREPARATION OF CLIMATE ATLAS Sitke (Hungary); 10 - 14 September 2007
THERE IS A MULTIPLICITY OF TESTS AVAILABLE • Simple (but elaborated!) formulatations Craddock Test + Metadata • Caussinus-Mestre • Likelihood ratio tests SNHT and variants • Regression model tests Vincent • Two Phase Regression Wang • MASH will be discused later on by T. Szentimrey • For introductory explanations on these and other methods, see Aguilar et al (2003)*: Guidance on Metadata and Homogenization, WMO-TD-1186. • *: This is almost 5 years old… see later on slides on COST-HOME action! SUMMER SCHOOL ON THE PREPARATION OF CLIMATE ATLAS Sitke (Hungary); 10 - 14 September 2007
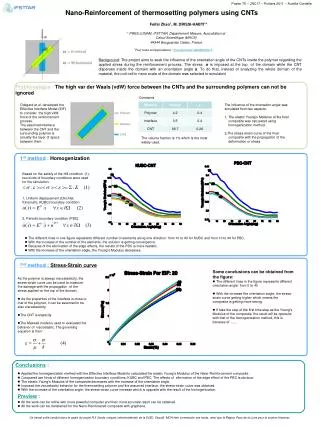
ON THE APLICATION OF THE CRADDOCK TESTS • Auer et al (2007)and many others apply the Craddock Test to climatological data • The test has a simple formulation and HISTALP heavily relies on metadata and expertise to identify/confirm/reject potential breaks • It accumulates the normalized differences between two series (a and b) according to one of the following formulas: • Where: s is the sum at the current obs; s-1 the sum at the previous obs; an is the obs at the candidate station; am is the mean of the candidate station; bn is the obs at the reference station; bm is the mean of the reference station SUMMER SCHOOL ON THE PREPARATION OF CLIMATE ATLAS Sitke (Hungary); 10 - 14 September 2007
From Maugheri, M. SUMMER SCHOOL ON THE PREPARATION OF CLIMATE ATLAS Sitke (Hungary); 10 - 14 September 2007
News about a damage to the pluviometer. In corrispondence with repairing the damage, the cause of the underestimation of precipitation has been removed for the period 1900-1928 Craddock test - Bologna precipitation record “All’inizio del 1857 a questo pluviometro, ridotto in cattivo stato pel lungo uso, ne venne sostituito un altro di migliore costruzione, e lavorato con molta precisione...” Change in data origin: from “Osservatorio Astronomico” to “Istituto Idrografico” Introduction of a new pluviometer (Fuess recorder): “... fu collocato a cura del prof Bernardo Dessau nel periodo 1900-1903 ...” From Maugheri, M. SUMMER SCHOOL ON THE PREPARATION OF CLIMATE ATLAS Sitke (Hungary); 10 - 14 September 2007
ON THE APPLICATION OF CRADDOCK TEST (generalizable to homogeneity work) • Auer et al (2007) say: • For the nucleus of homogeneity testing (the comparison of two series) we use Craddock’s normalised accumulated difference/ ratio series (Craddock, 1979), although HOCLIS would allow any method of relative homogeneity testing to be used. The practical experience in our group with a number of such methods tells us that the rejection of break signals due to statistical non-significance(as provided by higher developed methods) is often misleading. Strong breaks may remain in the series simply owing to the fact that the typical length of a homogeneous subinterval (Table I) is short in relation to interannual variability. We try to compensate for the deficits of our method in pure statistical terms by investing much work into metadata analysis, which we regard as the ultimate measure to decide whether a break can be accepted or not. SUMMER SCHOOL ON THE PREPARATION OF CLIMATE ATLAS Sitke (Hungary); 10 - 14 September 2007
ON THE APPLICATION OF CRADDOCK TEST 1. Ignore any previous homogeneity work undertaken for any of the series (i.e. start from the beginning, assuming all series contain potential breaks). 2. Test in small, well-correlated subregions (a maximum of 10 series tested against each other results in a 10 × 10 decision matrix, which enables most breaks detected to be assigned to a most likely candidate series). 3. Choose the most appropriate reference series with a non-affected subinterval for the adjustment of each break detected (i.e. different reference series can be used for each break detected in a candidate series). 4. Avoid erratic monthly precipitation adjustments by smoothing the annual course of adjustment factors. 5. Detect outliers and ‘overshooting adjustments’ using spatial comparisons (by mapping precipitation values both in absolute and relative units) for each month of the study period. 6. Attempt to determine support for homogeneity adjustments when few metadata are available (i.e. contact data providers for more information in difficult cases). Auer et al (2005) SUMMER SCHOOL ON THE PREPARATION OF CLIMATE ATLAS Sitke (Hungary); 10 - 14 September 2007
LIKELIHOOD RATIO TESTS: THE STANDARD NORMAL HOMOGENEITY TEST AND VARIANTS • Formulated by Alexandersson (1986) and Alexandersson et al (1997) • Critical values derived after MCS • Recently Khaliq and Ouarda have recalculated the critical values using improved MCS • Widely re-formulated (for example, Reeves et al, 2006) • Widely applied (will see example by CCRG) SUMMER SCHOOL ON THE PREPARATION OF CLIMATE ATLAS Sitke (Hungary); 10 - 14 September 2007
Original Data Reference Series q-series (data-reference) z-series (standarized q-series) SHNT SUMMER SCHOOL ON THE PREPARATION OF CLIMATE ATLAS Sitke (Hungary); 10 - 14 September 2007
SNHT Most Probable Breakpoint: Max of Correction Factor: SUMMER SCHOOL ON THE PREPARATION OF CLIMATE ATLAS Sitke (Hungary); 10 - 14 September 2007
SNHT MODIFICATIONS BY REEVES et al (2007) • The standarization into z series proposed by Alexandersson : • Uses s to estimate the standard deviation of the series, which might be ineficient if the candidate series is inhomogeneous • They propose to avoid standarization by using: SUMMER SCHOOL ON THE PREPARATION OF CLIMATE ATLAS Sitke (Hungary); 10 - 14 September 2007
A HOMOGENIZATION PROCEDURE BASED ON THE SNHT TEST (AND OTHER METHODS) QCd daily data of TMax and TMin Calculation of Monthly Values of TMax and TMin Screen Bias Minimisation over monthly series of TMax and TMin Blind break-point detection over annual, seasonal TMax, Tmin, Tmean with automated SNHT (1997) Breakpoint validation (metadata, plot checks, …) Application to monthly Tmax and Tmin (As described in Aguilar et al, 2002) Generation of correction pattern Monthly, Seasonal, Annual Tmax, Tmin, DTR, TMean Series (STS) Validation of daily corrected values Interpolation to daily data (Vincent et al., 2002) SDTS Aguilar, E., Brunet, M., Saladié, O., Sigró, J. : Homogenization of the Spanish Daily Temperature Series. A step forward. SUMMER SCHOOL ON THE PREPARATION OF CLIMATE ATLAS Sitke (Hungary); 10 - 14 September 2007
SCREEN BIAS MINIMIZATION SUMMER SCHOOL ON THE PREPARATION OF CLIMATE ATLAS Sitke (Hungary); 10 - 14 September 2007
SCREEN BIAS MINIMIZATION Large effect on TMax Much smaller effect on TMin CCRG’s SCREEN project (CICYT) 2 replicas of Montsouris Screen, on operation since 2003 SUMMER SCHOOL ON THE PREPARATION OF CLIMATE ATLAS Sitke (Hungary); 10 - 14 September 2007
SCREEN BIAS MINIMIZATION Murcia: TMaxStev = -0.508 + TMaxMont*0.975 SUMMER SCHOOL ON THE PREPARATION OF CLIMATE ATLAS Sitke (Hungary); 10 - 14 September 2007
SCREEN BIAS MINIMIZATION Tmax data for Murcia (August) Red: Murcia Original Green: Murcia Screen-Corrected SUMMER SCHOOL ON THE PREPARATION OF CLIMATE ATLAS Sitke (Hungary); 10 - 14 September 2007
Original Data Reference Series q-series (data-reference) z-series (standarized q-series) BREAK POINT DETECTION BLIND RUN OF AUTOMATED SNHT (see ALEXANDERSON ET AL., 1997) OVER ANNUAL AND SEASONAL VALUES OF TMAX, TMIN, TMEAN AND DTR SUMMER SCHOOL ON THE PREPARATION OF CLIMATE ATLAS Sitke (Hungary); 10 - 14 September 2007
BREAK POINT DETECTION BLIND RUN OF AUTOMATED SNHT (see ALEXANDERSON ET AL., 1997) OVER ANNUAL AND SEASONAL VALUES OF TMAX, TMIN, TMEAN AND DTR Most Probable Breakpoint: Max of Correction Factor: SUMMER SCHOOL ON THE PREPARATION OF CLIMATE ATLAS Sitke (Hungary); 10 - 14 September 2007
BREAK POINT DETECTION SUMMER SCHOOL ON THE PREPARATION OF CLIMATE ATLAS Sitke (Hungary); 10 - 14 September 2007
BREAK POINT VALIDATION Green: number of references Red: z-series Tm Detection 03 17 1955 -1.89 Tn Detection 03 17 1914 5.51 03 17 1954 -2.58 03 17 1935 2.16 Tx Detection 03 17 1970 2.54 SUMMER SCHOOL ON THE PREPARATION OF CLIMATE ATLAS Sitke (Hungary); 10 - 14 September 2007
CORRECTION PATERN In 1954 station was relocated from the city center to the airport Green: number of references Red: z-series Period: 1880-2006 SUMMER SCHOOL ON THE PREPARATION OF CLIMATE ATLAS Sitke (Hungary); 10 - 14 September 2007
CORRECTION RESULTS OVER ANNUAL TMean (BADAJOZ) Original Corrected Red: original; green: corrected (Screen +SNHT) SUMMER SCHOOL ON THE PREPARATION OF CLIMATE ATLAS Sitke (Hungary); 10 - 14 September 2007
APPLICATION TO MONTHLY SERIESBADAJOZ, TMax All Values in 1/10th of ºC SUMMER SCHOOL ON THE PREPARATION OF CLIMATE ATLAS Sitke (Hungary); 10 - 14 September 2007
ADJUSTMENT OF MONTHLY SERIES August TX January TX Red: original; green: adjusted SUMMER SCHOOL ON THE PREPARATION OF CLIMATE ATLAS Sitke (Hungary); 10 - 14 September 2007
CONVERTING MONTHLY FACTORS TO DAILY FACTORS Following Vincent et al. (2002), monthly factors are assigned to the 15th of each month to avoid abrupt discontinuities at the end of the month SUMMER SCHOOL ON THE PREPARATION OF CLIMATE ATLAS Sitke (Hungary); 10 - 14 September 2007
CLIMATE CHANGE INDICES DERIVED FROM DAILY TIME SERIES Badajoz, TX90p índex Red: oiginal Green: corrected SUMMER SCHOOL ON THE PREPARATION OF CLIMATE ATLAS Sitke (Hungary); 10 - 14 September 2007
CLIMATE CHANGE INDICES DERIVED FROM DAILY TIME SERIES Badajoz, TX10p índex Red: oiginal Green: corrected SUMMER SCHOOL ON THE PREPARATION OF CLIMATE ATLAS Sitke (Hungary); 10 - 14 September 2007
CLIMATE CHANGE INDICES DERIVED FROM DAILY TIME SERIES Badajoz, TN90p índex Red: oiginal Green: corrected SUMMER SCHOOL ON THE PREPARATION OF CLIMATE ATLAS Sitke (Hungary); 10 - 14 September 2007
CLIMATE CHANGE INDICES DERIVED FROM DAILY TIME SERIES Badajoz, TN10p índex Red: oiginal Green: corrected SUMMER SCHOOL ON THE PREPARATION OF CLIMATE ATLAS Sitke (Hungary); 10 - 14 September 2007
CAUSSINUS and MESTRE (2004) • Use a fairly more complicated penalized log-likelihood procedure to correct groups of stations sharing the same climate signal • C-M assume that each series is the sum of climate effect, a station effect and a random white noise. The station effect is constant if the series is reliable (homogeneous). If not, the station effect is piecewise constant between two shifts (except for outliers) • The maximization of the statistic, and thus the model selection, implies testing a far too large number of combinations of break-points and oultiers positions SUMMER SCHOOL ON THE PREPARATION OF CLIMATE ATLAS Sitke (Hungary); 10 - 14 September 2007
CAUSSINUS and MESTRE (2004) • For practical application, pair-wise comparisons across the neighbours are performed by calculating difference series and the arising breaks/outliers are selected over a decission table. SUMMER SCHOOL ON THE PREPARATION OF CLIMATE ATLAS Sitke (Hungary); 10 - 14 September 2007