Download
1 / 1
10 likes | 139 Views
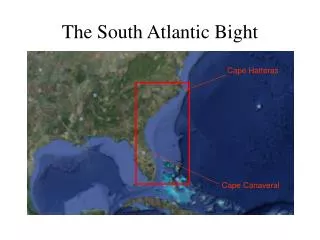
Semyon A. Grodsky and James A. Carton, University of Maryland, College Park, MD, USA.

E N D
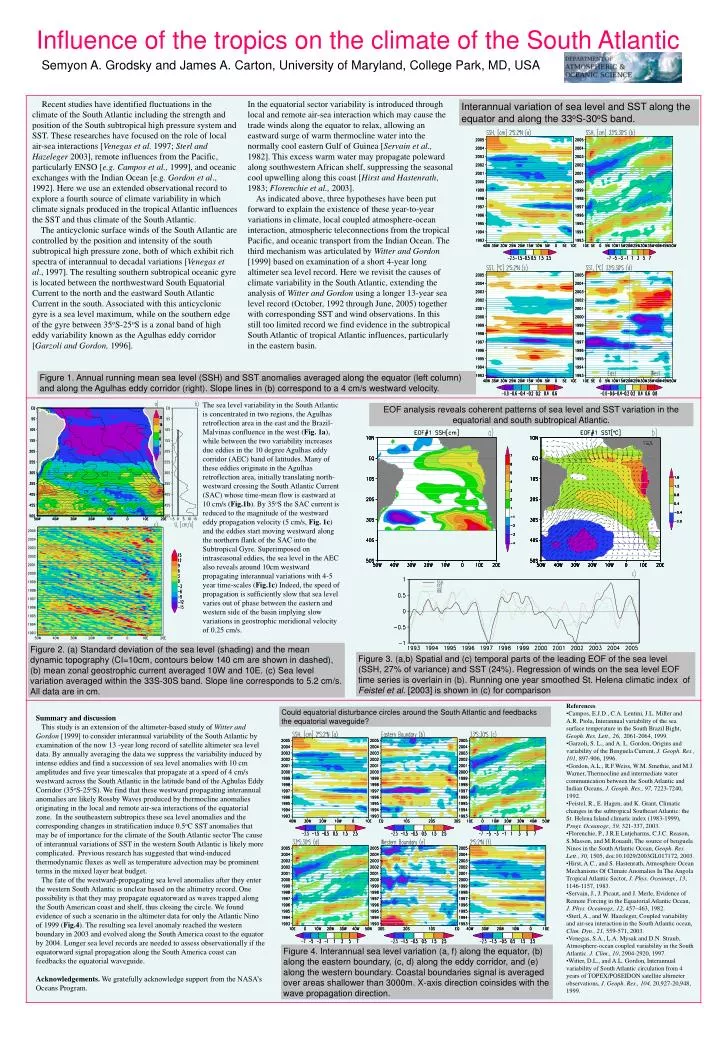
Semyon A. Grodsky and James A. Carton, University of Maryland, College Park, MD, USA Recent studies have identified fluctuations in the climate of the South Atlantic including the strength and position of the South subtropical high pressure system and SST. These researches have focused on the role of local air-sea interactions [Venegas et al. 1997; Sterl and Hazeleger 2003], remote influences from the Pacific, particularly ENSO [e.g. Campos et al., 1999], and oceanic exchanges with the Indian Ocean [e.g. Gordon et al., 1992]. Here we use an extended observational record to explore a fourth source of climate variability in which climate signals produced in the tropical Atlantic influences the SST and thus climate of the South Atlantic. The anticyclonic surface winds of the South Atlantic are controlled by the position and intensity of the south subtropical high pressure zone, both of which exhibit rich spectra of interannual to decadal variations [Venegas et al., 1997]. The resulting southern subtropical oceanic gyre is located between the northwestward South Equatorial Current to the north and the eastward South Atlantic Current in the south. Associated with this anticyclonic gyre is a sea level maximum, while on the southern edge of the gyre between 35oS-25oS is a zonal band of high eddy variability known as the Agulhas eddy corridor [Garzoli and Gordon, 1996]. In the equatorial sector variability is introduced through local and remote air-sea interaction which may cause the trade winds along the equator to relax, allowing an eastward surge of warm thermocline water into the normally cool eastern Gulf of Guinea [Servain et al., 1982]. This excess warm water may propagate poleward along southwestern African shelf, suppressing the seasonal cool upwelling along this coast [Hirst and Hastenrath, 1983; Florenchie et al., 2003]. As indicated above, three hypotheses have been put forward to explain the existence of these year-to-year variations in climate, local coupled atmosphere-ocean interaction, atmospheric teleconnections from the tropical Pacific, and oceanic transport from the Indian Ocean. The third mechanism was articulated by Witter and Gordon [1999] based on examination of a short 4-year long altimeter sea level record. Here we revisit the causes of climate variability in the South Atlantic, extending the analysis of Witter and Gordon using a longer 13-year sea level record (October, 1992 through June, 2005) together with corresponding SST and wind observations. In this still too limited record we find evidence in the subtropical South Atlantic of tropical Atlantic influences, particularly in the eastern basin. Interannual variation of sea level and SST along the equator and along the 33oS-30oS band. Influence of the tropics on the climate of the South Atlantic Figure 1. Annual running mean sea level (SSH) and SST anomalies averaged along the equator (left column) and along the Agulhas eddy corridor (right). Slope lines in (b) correspond to a 4 cm/s westward velocity. The sea level variability in the South Atlantic is concentrated in two regions, the Agulhas retroflection area in the east and the Brazil-Malvinas confluence in the west (Fig. 1a), while between the two variability increases due eddies in the 10 degree Agulhas eddy corridor (AEC) band of latitudes. Many of these eddies originate in the Agulhas retroflection area, initially translating north-westward crossing the South Atlantic Current (SAC) whose time-mean flow is eastward at 10 cm/s (Fig.1b). By 35oS the SAC current is reduced to the magnitude of the westward eddy propagation velocity (5 cm/s, Fig. 1c) and the eddies start moving westward along the northern flank of the SAC into the Subtropical Gyre. Superimposed on intraseasonal eddies, the sea level in the AEC also reveals around 10cm westward propagating interannual variations with 4-5 year time-scales (Fig.1c) Indeed, the speed of propagation is sufficiently slow that sea level varies out of phase between the eastern and western side of the basin implying slow variations in geostrophic meridional velocity of 0.25 cm/s. EOF analysis reveals coherent patterns of sea level and SST variation in the equatorial and south subtropical Atlantic. Figure 2. (a) Standard deviation of the sea level (shading) and the mean dynamic topography (CI=10cm, contours below 140 cm are shown in dashed), (b) mean zonal geostrophic current averaged 10W and 10E. (c) Sea level variation averaged within the 33S-30S band. Slope line corresponds to 5.2 cm/s. All data are in cm. Figure 3. (a,b) Spatial and (c) temporal parts of the leading EOF of the sea level (SSH, 27% of variance) and SST (24%). Regression of winds on the sea level EOF time series is overlain in (b). Running one year smoothed St. Helena climatic index of Feistel et al. [2003] is shown in (c) for comparison • References • Campos, E.J.D., C.A. Lentini, J.L. Miller and A.R. Piola, Interannual variability of the sea surface temperature in the South Brazil Bight, Geoph. Res. Lett., 26,. 2061-2064, 1999. • Garzoli, S. L., and A. L. Gordon, Origins and variability of the Benguela Current, J. Geoph. Res., 101, 897-906, 1996. • Gordon, A.L., R.F.Weiss, W.M. Smethie, and M.J. Warner, Thermocline and intermediate water communication between the South Atlantic and Indian Oceans, J. Geoph. Res., 97, 7223-7240, 1992. • Feistel, R., E. Hagen, and K. Grant, Climatic changes in the subtropical Southeast Atlantic: the St. Helena Island climatic index (1983-1999), Progr. Oceanogr., 59, 321-337, 2003. • Florenchie, P., J.R.E Lutjeharms, C.J.C. Reason, S.Masson, and M.Rouault, The source of benguela Ninos in the South Atlantic Ocean, Geoph. Res. Lett., 30, 1505, doi:10.1029/2003GL017172, 2003. • Hirst, A.C., and S. Hastenrath, Atmosphere Ocean Mechanisms Of Climate Anomalies In The Angola Tropical Atlantic Sector, J. Phys. Oceanogr., 13, 1146-1157, 1983. • Servain, J., J. Picaut, and J. Merle, Evidence of Remote Forcing in the Equatorial Atlantic Ocean, J. Phys. Oceanogr., 12, 457–463, 1982. • Sterl, A., and W. Hazeleger, Coupled variability and air-sea interaction in the South Atlantic ocean, Clim. Dyn., 21, 559-571, 2003. • Venegas, S.A., L.A. Mysak and D.N. Straub, Atmosphere-ocean coupled variability in the South Atlantic. J. Clim., 10, 2904-2920, 1997. • Witter, D.L., and A.L. Gordon, Interannual variability of South Atlantic circulation from 4 years of TOPEX/POSEIDON satellite altimeter observations, J. Geoph. Res., 104, 20,927-20,948, 1999. Could equatorial disturbance circles around the South Atlantic and feedbacks the equatorial waveguide? Summary and discussion This study is an extension of the altimeter-based study of Witter and Gordon [1999] to consider interannual variability of the South Atlantic by examination of the now 13 -year long record of satellite altimeter sea level data. By annually averaging the data we suppress the variability induced by intense eddies and find a succession of sea level anomalies with 10 cm amplitudes and five year timescales that propagate at a speed of 4 cm/s westward across the South Atlantic in the latitude band of the Aghulas Eddy Corridor (35oS-25oS). We find that these westward propagating interannual anomalies are likely Rossby Waves produced by thermocline anomalies originating in the local and remote air-sea interactions of the equatorial zone. In the southeastern subtropics these sea level anomalies and the corresponding changes in stratification induce 0.5oC SST anomalies that may be of importance for the climate of the South Atlantic sector The cause of interannual variations of SST in the western South Atlantic is likely more complicated. Previous research has suggested that wind-induced thermodynamic fluxes as well as temperature advection may be prominent terms in the mixed layer heat budget. The fate of the westward-propagating sea level anomalies after they enter the western South Atlantic is unclear based on the altimetry record. One possibility is that they may propagate equatorward as waves trapped along the South American coast and shelf, thus closing the circle. We found evidence of such a scenario in the altimeter data for only the Atlantic Nino of 1999 (Fig.4). The resulting sea level anomaly reached the western boundary in 2003 and evolved along the South America coast to the equator by 2004. Longer sea level records are needed to assess observationally if the equatorward signal propagation along the South America coast can feedbacks the equatorial waveguide. Acknowledgements. We gratefully acknowledge support from the NASA’s Oceans Program. Figure 4. Interannual sea level variation (a, f) along the equator, (b) along the eastern boundary, (c, d) along the eddy corridor, and (e) along the western boundary. Coastal boundaries signal is averaged over areas shallower than 3000m. X-axis direction coinsides with the wave propagation direction.