Download
1 / 34
340 likes | 423 Views
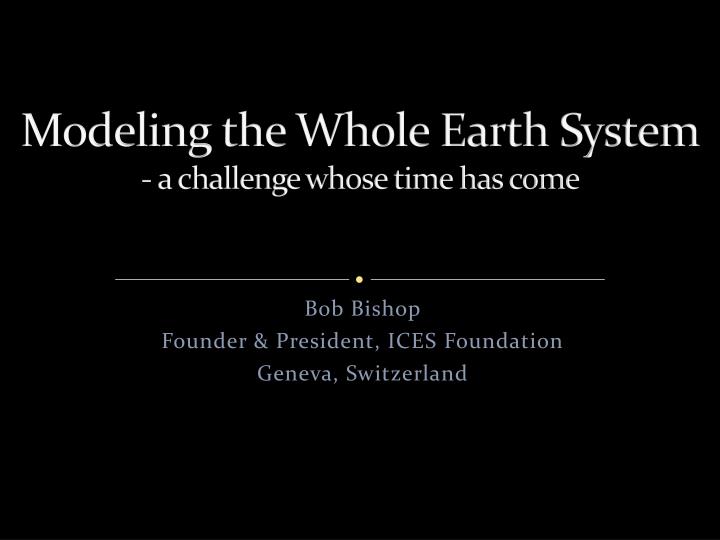
Modeling the Whole Earth System - a challenge whose time has come. Bob Bishop Founder & President, ICES Foundation Geneva, Switzerland. Blue Marble from Apollo 17 (taken from 45,000km on December 7, 1972 at 10:39 UTC).

E N D
Modeling the Whole Earth System- a challenge whose time has come Bob Bishop Founder & President, ICES Foundation Geneva, Switzerland
Blue Marble from Apollo 17 (taken from 45,000km on December 7, 1972 at 10:39 UTC)
Vast pools of data are now at our fingertips!- especially from Earth Observation technologies … • 40 years of Landsat • AMS, NPP, Cryosat, GOCE, SMOS, ISS, SDO, Hubble • robotics, remote-sensing and in-situ sensor networks • Doppler, lidar, ocean buoys, cabled oceans, wave gliders Such devices are now generating petabytes each day, and soon exabytes & zettabytes of real-time, high-res, rich streaming data
New generation ‘social data’ is available from countless new ‘social’ data sources … - creating even more ‘big and rich data’… • financial data • digital medical imaging • digital government services • digitized books, libraries, broadcasting • social networking sites, blogs, smart phones, webcams - LinkedIn, Facebook, Twitter, etc. Overall, digital source data is increasing faster than Moore’s Law!
With this ‘exaflood’ of data at our fingertips – how to make sense of what we already know? - our main problem is no longer how to collect it … • but how to move, store, harmonize and curate it • and then federate it • mine it • and finally assimilate it into our models Integrative computational models can clarify data sets whose sheer size would otherwise place them outside of human ken
Modern IT power tools help us convert from - data to info to knowledge, & hopefully to wisdom ... • modeling & simulation • data mining & analytics • high performance computing • interactive, immersive, 4D visualization In fact, we don’t really understand a scientific phenomenon until it can be computationally modeled and visualized!
The main goal of our power tools & data sets: -hidden & holistic insights into planetary life- insights that educate, encourage discovery, and ... • help protect the planet • preserve biodiversity • keep people safe • allow society to grow • keep our society resilient • improve our global policy making Above all, insights that help us govern the planet in a healthy, coherent, balanced, and equitable manner!
This is a tall order – and the recent string of disasters suggests that we know only a little! - in the US alone, both natural and unnatural causes … • 40,000 heat records have been broken in 2012 so far! • July 2012 hottest month on record - 64% drought • wildfires , violent storms, derechos • tornadoes, hurricanes • Deep Horizon spill • Katrina And outside of North America things are even worse!
Immense loss of life and property destruction$366B loss in 2011 and escalating grief on a global basis • The Great East Asian Earthquake & Tsunami of 3/11 • Fukushima nuclear meltdown & contamination • Banda Aceh quake & tsunami of December 2004 • Bangkok, Pakistan, Queensland floods of 2010~12 • Russian heatwave of 2010, European heatwave 2003 • Chile ash cloud of 2012, Iceland ash cloud 2010 • Italian, Iran, Chile, NZ, Haiti, Szechuan earthquakes Increasing population density means more ‘black swan’ events!
Future Change in Extreme Summer Drought Late 20th C to Late 21st C 4X probability of extreme summer drought in Great Plains, Florida, Yucutan, and parts of Eurasia 10th Percentile Drought: Number of years out of 47 in a simulation of future climate (2071-2117) for which the June-August mean rainfall was less than the 5th driest year of 47 in a simulation of current climate (1961-2007). Dirmeyer et al. 2012
‘Multiple Synchronous Collapse’ is common - a cascading domino effect across boundaries!
Tohoku earthquake & tsunami is a clear example- one domino falls after another after another… • M9.0 megathrust in an offshore subduction zone • 10m tsunami hits coastline 30 minutes later • 400,00 homes destroyed – 19,850 fatalities • factory supply chain disrupted worldwide • three nuclear reactors fail at Fukushima • radioactive contamination spreads • Japan turns off 50 of its 52 nuclear reactors • Japan PM resigns, TEPCO nationalized, $200B+ so far Switzerland, Germany, Italy cancel future nuclear power plans!
Such crisis events are the complex result of many interacting sub-systems and non-linear feedback loops, both positive and negative - dangers are exacerbated because … • quarterly profit demands drive ‘just in time’ behavior • low reserves & safety margins = ‘brittle’ social fabric • ‘optimized complexity’ creates lack of resilience • our organizations become knowledge silos • we are seriously over specialized Few see the whole picture - precursor signals are hard to detect!
Globally, we are in danger of transgressing the Nine Planetary Boundaries- as outlined by the Stockholm Resilience Centre … • climate change ~ CO2 ppm ~ global warming • ocean acidification • stratospheric ozone • global P and N cycles • aerosol loading • freshwater usage • land use changes • biodiversity loss • chemical pollution Maybe we have already crossed several critical ‘tipping points’?
Thermodynamic radiation model (λ=nrdc) 4 slides from David Wasdell: Apollo-Gaia Project, UK
Intense UN efforts have raised issue urgency- but have hardly resolved the problem … • UNEP: the Montreal Protocol of 1987 for CFC control • IPCC: created 1988 by the WMO and UNEP. AR5 due 2013 • UNDP: Earth Summit (Rio 1982) Sustainable Development: Rio+20 (2012) • UNFCCC: Kyoto Protocol (1997), Copenhagen, Cancun, Durban • UNISDR: Hyogo Framework (2005) • WCRP-ICSU-IHDP-IGBP: Planet under Pressure (London, 2012) Agenda: climate change, global warming, adaptation, mitigation, sea level rise, disaster risk reduction, sustainability, resilience
Coupled Model Intercomparison Project Phase 5 as part of AR5 due September 2013- 27 modeling centers have submitted 55 models … • hindcasting the recent past climate • forecasting the future climate for years 2035 and 2100 • quantifying cloud feedback effects and the carbon cycle But how to take account of social responses and interactions?
Integrated Assessment Models within CMIP5- introducing social feedback into climate models … • mitigation strategies • adaptation strategies • social development pathways & scenarios - demographics, economies, technologies, policies - direction of change, response to impacts Complex analysis of model hierarchies & ensemble averages!
Will we ever integrate models successfully to view the Earth System globally & holistically?- are nations and govts too specialized and inflexible? • can any one country afford it? • will our computers ever be fast enough? • will our grid resolution ever be fine enough? • will or coupling algorithms be good enough? • will our scientific & social knowledge ever be deep enough? On the other hand – isn’t integration what the public expects?
Towards Comprehensive Earth System Models 1970 1997 2000 1975 1985 1992 Atmosphere Atmosphere Atmosphere Atmosphere Atmosphere Atmosphere Land surface Land surface Land surface Land surface Land surface Ocean & sea-ice Ocean & sea-ice Ocean & sea-ice Ocean & sea-ice Sulphate aerosol Sulphate aerosol Sulphate aerosol Non-sulphate aerosol Non-sulphate aerosol Carbon cycle Carbon cycle Atmospheric chemistry Off-line model development Strengthening colours denote improvements in models Sulphur cycle model Non-sulphate aerosols Ocean & sea-ice model Land carbon cycle model Carbon cycle model Ocean carbon cycle model The Met.OfficeHadley Centre Atmospheric chemistry Atmospheric chemistry
Mission of the ICES Foundation - established January 2010 in Geneva • Swiss based not-for-profit • private-public-partnership • neutral, independent & non-political • partnering with national climate, geo & space centers • partnering with university research centers • partnering with International Orgs & NGOs • dedicating 25% of resources to developing world • dedicated to research, discovery and policy guidance ICES is structured with a Board, Expert & Ethics Committees, and is privately funded!
The ICES 10-year roadmap- integrating natural and socioeconomic sciences • coupled weather~climate (seasonal, annual, decadal, centennl) • coupled ecosystems, environment & biosphere models • coupled mantle, volcanic & tectonic plate models • coupled Earth’s magnetosphere & core dynamics • coupled solar wind and other planetary sciences • extension of natural sciences to socioeconomics: - resource depletion, sustainability, resilience - transport, emissions, pollution - energy, water, food, health - geoengineering Open science, open publishing, open data files, open source code!
ICES & role of High Performance Computing- flexibilty on the road to exascale • grids, clouds, clusters, supercomputing • the power wall, the memory wall, IMDGs • CPUGPUs, FPGAs, ASICs, accelerators • variable precision, bit-reproducible, bit-deviant • application profile, scalability, hardware resilience • application specific co-design of hardware/software • neuromorphic • probabilistic multi-exaflop visual Earth-System simulator We desire to put the scientist ‘in the loop’ and make the system visually 4D, interactive and immersive!
ICES network of regional projects – multiple discussions underway … • Cascadian Resilience Center • Southern California • Great rivers • The Alps • Arctic • Antactic Open Partners: Climate Code, Zettascience Visual partner: Metanoiaa~Infinitas ICES in the press: ‘The CERN for Climate’ ‘The CERN for Sustainability’