Download
1 / 21
210 likes | 325 Views
Fisheries 101: Modeling and assessments to achieve sustainability. Training Module July 2013. Outline. Small Scale Unassessed Fisheries Fishery assessments How they can be used What are we trying to assess and why? Projection Modeling Overview

E N D
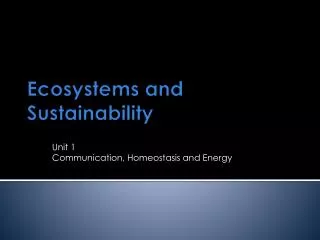
Fisheries 101: Modeling and assessments to achieve sustainability Training Module July 2013
Outline • Small Scale Unassessed Fisheries • Fishery assessments • How they can be used • What are we trying to assess and why? • Projection Modeling Overview • What are projection models and why should we use them? • Inputs and outputs
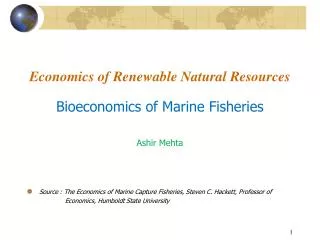
Global Fisheries The problem is most acute in small scale, coastal fisheries Costello et al., 2012, Science
Small Scale Unassessed Fisheries • Small scale, but collectively responsible for 40% of global catch • Account for 90% of all fishermen • Millions of jobs in fish processing, marketing, etc. • Many appear to be overfished and not producing as much food/money as possible • So what do we do?
Stock Assessments: The Foundation of Fisheries Management Landings by Gear Type 1. commercial 2. recreational Catch Demographic Data 1. age composition 2. length composition Life History Information growth, maturity, etc. Stock Assessment (statistical model) Fishery Independent Surveys (e.g., trawl surveys) Fishery Dependent Information (logbook data, discards, etc.) Biomass + Fishing Mortality Management Decision Courtesy of S. Ralston
Stock Assessments: The Foundation of Fisheries Management Landings by Gear Type 1. commercial 2. recreational Catch Demographic Data 1. age composition 2. length composition Life History Information growth, maturity, etc. > 80% of fisheries are unassessed Stock Assessment (statistical model) Fishery Independent Surveys (e.g., trawl surveys) Fishery Dependent Information (logbook data, discards, etc.) Biomass + Fishing Mortality Management Decision Courtesy of S. Ralston
Data Poor Assessments • Methods are less costly and data intensive than traditional assessments • Goal of the assessment is to make management decisions using only readily available information • A variety of approaches – we will highlight three of them
1. Marine Reserve-Based Decision Tree • This tool examines the length frequency and density of scientifically sampled fish inside and outside of marine reserves as well as trends in the catch • The model can then be used to adjust last years total allowable catch in order to achieve a target reference point Length Frequency Prime Young Old Wilson et al. 2010 Length
1. Marine Reserve-Based Decision Tree Compare CPUE of prime sized fish inside and outside of reserves Level 1 Evaluate CPUE of prime sized fish in fished area over previous 3-5 years rising stable falling Level 2 Compare CPUE and proportion of old fish in catch to SPR40 levels Level 3 Output: Adjustment to Total Allowable Catch (TAC) Evaluate CPUE of young fish over past 5 years Compare CPUE of young fish to SPR50 levels Evaluate CPUE of young fish over past 5 years Level 4
2. Spawning Potential Ratio (SPR) methods SPR = A measure of current egg production relative to unfished levels Lightly Fished No Fishing Spawning = 50% of unfished levels Spawning Potential Ratio target Spawning = 10% of unfished levels Heavily Fished Fishing Mortality
3. Catch Curve Analysis: using No-take Zones as Reference Areas Total Mortality (Z) = Natural (M) + Fishing (F) Mortality F =Z - M M = natural mortality Non-Reserve Reserve Z = M + F Wilson et al. in review
Outline • Small Scale Unassessed Fisheries • Fishery assessments • How they can be used • What are we trying to assess and why? • Projection Modeling Overview • What are projection models and why should we use them? • Inputs and outputs
What is a “projection model”? • A way to combine essential elements of a system to answer specific questions about management outcomes • Critical concepts • Level of detail required depends on question • General principles don’t answer specific questions • Assumptions must be clear, can be challenged • No model is exact to reality
Why use projection models? • Models can include more information than any individual can consider • Helps to organize thinking • Often reveal counterintuitive results • Models move from simple to complex based on the type of question you are addressing
Bioeconomic simulation models: Example of a simple simulation model • Population Dynamics • One species • Few parameters • One area Fish Icon courtesy of L. Allen Courtesy of S. Valencia and J. Wilson
Bioeconomicsimulation modeling: Moving toward more complex models • Population Dynamics • Age • Recruitment • Growth • Movement (larval and adult) • Mortality (natural and fishing) Fish Icon courtesy of L. Allen Courtesy of S. Valencia and J. Wilson
Bioeconomicsimulation modeling Moving toward more complex models (cont.) • Incorporate into the model: • Fishing effort – fleet dynamics • Habitat quality • Adult emigration • Larval spillover Fish Icon courtesy of L. Allen Courtesy of S. Valencia and J. Wilson
Complex Model inputs • Combines • Habitat (where are productive reefs) • Life history (reproduction, growth, migration) • Human behavior (where/how much they fish) • Community objectives (profit, sustainability, ecological outcomes, local employment) • Used for: • Scenario evaluation (what happens if …?) • Optimization (what’s the best place for ….?)
Example Outcomes Profits Biomass Time Time Decision Table- Compared with long term status quo
Summary • Stock assessments are costly and data intensive • Data poor stock assessments and projection models are ways to make predictions using basic/incomplete/imperfect data • No tool is perfect, but if you manage adaptively you can reconsider decisions over time