Download
1 / 14
140 likes | 257 Views
Experimental Prediction of Climate-related Malaria Incidence. T.N. Krishnamurti and Arindam Chakraborty Florida State University Tallahassee, Florida, U.S.A. Vikram M. Mehta The Center for Research on the Changing Earth System Columbia, Maryland, U.S.A. Amita V. Mehta

E N D
Experimental Prediction of Climate-related Malaria Incidence T.N. Krishnamurti and Arindam Chakraborty Florida State University Tallahassee, Florida, U.S.A. Vikram M. Mehta The Center for Research on the Changing Earth System Columbia, Maryland, U.S.A. Amita V. Mehta NASA-Goddard Space Flight Center and University of Maryland-Baltimore County Greenbelt, Maryland, U.S.A. Outline * Climate Variability and Malaria in India *The FSU Super-ensemble Technique with 13 Coupled Climate Models for Rainfall Prediction: An Experiment for Malaria Incidence Prediction in Botswana, Southern Africa * Next Steps for a Malaria Early Warning System in (Western) India
Poverty and Health: Malaria, an Example of Vector-borne Diseases Influenced by Climate Variability and Change • Malaria around for 4,000 years, influenced human history to a great extent • According to the WHO’s World Malaria Report 2005, 3.2 billion people lived in areas at risk of malaria transmission at the end of 2004 • 350 to 500 million clinical episodes of malaria every year • At least one million deaths every year due to malaria • Potential destabilization of socio-economic-political systems, triggering national/international security problems
Influence of El Niño-La Niña Climate Variability on Indian Rainfall and Malaria Incidence 3 million cases El Niño-La Niña Climate Index (gray) and annual number of malaria cases in India (blue) March-April- May • More rain and more malaria cases in western and northwestern India during La Niña (1996; left) • Less rain and fewer malaria cases in western and northwestern India during El Niño (1998; right) • Rain and malaria prediction 2-3 months in advance possible 1.8 million cases June-July- August 1990 1991 1992 1993 1994 1995 1996 1997 1998 1999 2000 Jun-Jul-Aug 1996 La Niña Jun-Jul-Aug 1998 El Niño
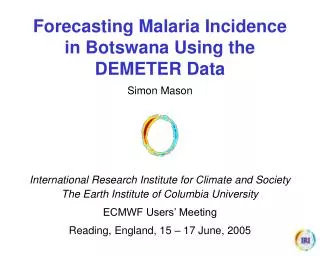
Seasonal Rainfall and Malaria Incidence Prediction in Botswana in Southern Africa: A Case Study • Malaria incidence dependent on rainfall, temperature, humidity, winds, land cover-use, topography, and other local conditions • Accurate seasonal prediction of rainfall, temperature, other hydro-meteorological variables, and land cover-use very useful for early warning of malaria risk and decision-making about prevention/mitigation • Application of the FSU multi-model synthetic super-ensemble technique with 13 coupled climate models in predicting malaria incidence a season in advance in Botswana, using only rainfall prediction
Model Forecasts per month Length of forecasts (in months) Total forecasts during 1989-2001 Each of 4 FSU models (ANR, AOR, KNR, KOR) 1 3 (starting every month) (13 x 12 x 3 = ) 468 CCM3 1 3 (starting every month) (13 x 12 x 3 = ) 468 POAMA1 1 3 (starting every month) (13 x 12 x 9 = ) 1404 Each of 7 DEMETER models (CERFACS, ECMWF, INGV, LODYC, MPI, MeteoFrance, UKMO) 9 6 (starting every 3 months) (13 x 4 x 9 x 6 =) 2808 Total Forecast Data Sets Available for the Present Study Total Forecasts = 23400 ( = 468 x 5 + 1404 + 2808 x 7)
Methodology • Seasonal, super-ensemble rainfall forecasts from 13 coupled atmosphere-ocean models from March 1989 to February 2002 over 17.5o-30.0oE, 27.5oS-17.5oS • Three months’ lead time forecasts for the peak malaria incidence month of March
Adjusted Malaria Incidence and Rainfall December to February 1981-82 to 2001-02 • Adjusted log (malaria incidence) (AMI, per 1000 people) in Botswana related to summer (December-February) rainfall (and other factors) • Initial increase in AMI with increase in rainfall and decrease in very heavy rainfall because mosquito breeding areas washed away Empirical relationship between AMI and rainfall P (mm/day) in Botswana: AMI = -0.2541 P2 + 1.9558 P - 3.2823
Step 1: December Forecast of December- January-February Rainfall Rainfall Forecasts made in December for December-January-February Season using Super-ensemble and Ensemble-mean Techniques Super-ensemble (SSE) provides more accurate rainfall forecasts compared to the ensemble mean (EM).
Step 2: Forecast of March Malaria Incidence from the December Rainfall Forecast More Accurate Forecasts of Larger Outbreaks Malaria Cases per 1000 People 4 1 0.25 SSE Provides Better Malaria Prediction (Correlation = 0.19, RMSE = 0.52) Compared to EM (Correlation=-0.47, RMSE=0.68).
Next Steps to Develop a Malaria Early Warning System in Western India *A network of government and private health professionals, hydro-meteorological specialists, and climate prediction specialists *A malaria observing system consisting of weather observing stations, malaria data gatherers, and a central/distributed data archive system *A very-high resolution (~10 kms.) seasonal climate prediction system for Western India; synergy with agricultural and water resources impacts prediction * Quantification of relationships between malaria incidence, hydro-meteorological variables, land cover-use, and other local factors at a very-high spatial resolution *Quantitative assessments of monsoon climate variability’s, including extreme weather events’, impacts on vector-borne diseases, especially malaria, regional economies, and other societal matters
Multimodel FSU Conventional Super-ensemble • The superensemble forecast is constructed as, where, are the ith model forecasts. are the mean of the ith model forecasts over the training period. is the observed mean of the training period. are the regression coefficient obtained by a minimization procedure during the training period. Those may vary in space but are constant in time. is the number of forecast models involved. The coefficients ai are derived from estimating the minimum of function, the mean square error. • Multimodel bias removed ensemble is defined as, • In addition to removing the bias, the superensemble scales the individual model forecasts contributions according to their relative performance in the training period in a way that, mathematically, is equivalent to weighting them.
Generating Synthetic Data Using EOF Multimodel Synthetic Ensemble/Superensemble Prediction System PC EOF Training Forecast i = model n = mode N - Actual Data Sets Observed Analysis Estimating Consistent Pattern What is matching spatial pattern in forecast data Fi(x,t), which evolves according to PC time series P(t) of observed data, O(x,t) ? Forecasts Obs Normalized Weights N - Synthetic Data Sets Observation