Download
1 / 33
330 likes | 459 Views
Standardisation, Harmonisation and Measurement. Paul Lambert, 24-25 August 2009 Talk to the ‘Data Management for Social Survey Research’ training workshop, part of the Data Management through e-Social Science research Node of the National Centre for e-Social Science

E N D
Standardisation, Harmonisation and Measurement Paul Lambert, 24-25 August 2009 Talk to the ‘Data Management for Social Survey Research’ training workshop, part of the Data Management through e-Social Science research Node of the National Centre for e-Social Science www.dames.org.uk / www.ncess.acuk
Standardisation, Harmonisation and Measurement • The idea of measurement • Data management and categorical data • Standardizing categorical data • Supporting the standardization of categorical data Adapted from: Lambert, P. S., Gayle, V., Bowes, A. M., Blum, J. M., Jones, S. B., Sinnott, R. O., et al. (2009). Standards setting when standardizing categorical data. Cologne, 24-26 June 2009: Paper presented to the Fifth International Conference on Social Science Methodology, organised by GESIS and the National Centre for e-Social Science, and http://www.dames.org.uk/publications.htmlthrough
Ideas about measurement • Survey analysis involves scanning across cases for relations between variables • Identification of variable effects relies on structured empirical differences between cases • It doesn’t follow that how a measure was defined corresponds to that empirical identification • Example: Age and educational qualifications • It is desirable to keep an open mind over the interpretation of an empirical pattern (explore more options and test more variations)
Example from occupational research Broad concordance of schemes • Measures mostly measure the same thing • Generalised concepts are better • Criterion validity is asymmetric [cf. Tahlin 2007] Lambert, P. S., & Bihagen, E. (2007). Concepts and Measures: Empirical evidence on the interpretation of ESeC and other occupation-based social classifications. Paper presented at the International Sociological Association, Research Committee 28 on Social Stratification and Mobility, Montreal (14-17 August).
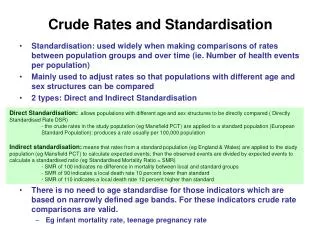
2) Data management and categorical data ‘categorical data’ = values in a quantitative dataset where the numeric data represents membership of groups (categories) but has no direct arithmetic meaning • A ‘Qualitative’ type of quantitative data [‘metric’=data is arithmetic] • Ordinal/nominal forms, & statistics [Stevens, 1946; Agresti, 2002]
Categorical data is important.. • Principal social survey datum • Basis of most social research reports/analyses/comparisons • It’s rich and complex • We’re often interested in very fine levels of detail / difference • We usually recode categories in some way for analysis • …how categorical data is managed is of great consequence to the results of analysis… Choices about recoding, boundaries, contrasts made [e.g. RAE analysis: Lambert & Gayle 2009]
3) Standardizing categorical data • ‘Standardization’ refers to treating variables for the purposes of analysis, in order to aid comparison between variables • {In the terminology of survey research analysts} 1. Arithmetic standardization to re-scale metric values [zi = (xi – x) / sd] 2. Ex-ante harmonisation (during data production) [ensuring measures of the same concept, collected from different contexts, are recorded in coordinated taxonomies] 3. Ex-post harmonisation [adapting measures of the same concept, collected from different contexts, using a coordinated re-coding procedure]
The big issue: standardization for comparisons • ‘Comparisons are the essence’ [Treiman, 2009: 382] ↔ to make statements about differences [in measures] over contexts • Categorical data is highly problematic.. • Can’t immediately conduct arithmetic standardization • Struggle to enforce harmonised data collection • ..which may not in any case be suitable.. • Struggle to achieve ex-post harmonisation • Non-linear relations between categories • Shifting underlying distributions
Two conventional ways to make comparisons[e.g. van Deth 2003] • Measurement equivalence = ex ante harmonisation (or ex post harmonisation) • Meaning equivalence = Arithmetic standardisation (or ex ante or ex post harmonisation) Much comparative research flounders on an insufficient recognition of strategies for equivalence (“One size doesn’t fit all, so we can’t go on”)
Measurement equivalence • (i) Measurement equivalence by assertion
(ii) Measurement equivalence example: ‘Lissification’ • Major research programme in ex-post harmonisation of Labour Force Surveys over time and between countries www.lisproject.org
(iii) Measurement equivalence and social class • Show tabplot here
Meaning equivalence • For categorical data, equivalence for comparisons is often best approached in terms of meaning equivalence (because of non-linear relations between categories and shifting underlying distributions) (even if measurement equivalence seems possible) • Arithmetic standardisation offers a convenient form of meaning equivalence by indicating relative position with the structure defined by the current context • For categorical data, this can be achieved by scaling categories in one or more dimension of difference
‘Effect proportional scaling’ using parents’ occupational advantage
A comment on ‘offsets’ and meaning equivalence- for comparisons between regressions, it is sometimes suitable to force the coefficients of some variables (e.g. controls) to have a certain fixed value- Below example (predicting income) using ‘cnsreg’ in Stata, e.g.: regress lninc fem age femage matrix define mod1m=e(b) scalar fem_coef=mod1m[1,1] constraint def 1 fem=fem_coef cnsreg lninc fem age femage mcamsis, constraints(1)
What we do and what we ought to do (when standardizing categories) Research applications tend to select a favoured categorisation of a concept and stick with it • Due to coordinated instructions [e.g. Blossfeld et al. 2006] • Due to perceived lack of available alternatives • Due to perceived convenience To make statistical analyses more robust we should… • Operationalise and deploy various scalings and arithmetic measures • Try out various of categorisations and explore their distributional properties • … and keep a replicable trail of all these activities..
4) Supporting the standardization of categorical data • GE*DE projects are concerned with allowing social science researchers to navigate, and exploit, heterogeneous information resources • Occupational Information Resources • Educational Information Resources • Ethnic minority/Migration Information Resources • We are finding that one of the most useful contributions is in helping with the standardization of categorical data
What makes this ‘e-Social Science’? • Standards setting • Metadata • Portal framework Liferay portal to various DAMES resources iRODS system for ‘GE*DE’ specialist data Controlled data access under security limits • Use of workflows
E.g. of GEODE v1: Organising and distributing specialist data resources (on occupations)
(i) Basic access to data Services to.. • search for and identify suitable information resources {Liferay portal and iRODS file connection} • allow merging these resources with own data {Non-trivial consideration – complex micro-data subject to security constraints} • Constructing new standardized resources for UK and major cross-national surveys E.g. Effect proportional scales for ethnic groups and educational qualifications across countries and over time CAMSIS scales for educational homophily (cf. www.camsis.stir.ac.uk)
(ii) Depositing data Services to… • Allow researchers to deposit specialist information resources to be immediately visible to others • Collect basic metadata via proforma, option of adding extended metadata (DDI structure) {Motivations are altruism; citations; reduced burdens} {Quality control through site rankings, expert inputs}
(iii) Workflows for recodes and standardisations • Documenting and distributing recodes / variable transformations / file matching operations • Ready access to previously used standardizations (avoid re-inventing the wheel) • Stata and SPSS focus (principal integrated data management / data analysis software for target users) • {includes files as resources; & generate syntax log file}
Conclusions and considerations • DAMES services are work in progress –www.dames.org.uk • Technical issues • Service delivery / Quality control • Scientific contributions • Progress in standardisations and ideas of equivalence • Suitable use of categorical data in social science data analysis! • Documentation for replication • Meta-analysis orientation
Data used • Department for Education and Employment. (1997). Family and Working Lives Survey, 1994-1995 [computer file]. Colchester, Essex: UK Data Archive [distributor], SN: 3704. • Heckmann, F., Penn, R. D., & Schnapper, D. (Eds.). (2001). Effectiveness of National Integration Strategies Towards Second Generation Migrant Youth in a Comparative Perspective - EFFNATIS. Bamberg: European Forum for Migration Studies, University of Bamberg. • Inglehart, R. (2000). World Values Surveys and European Values Surveys 1981-4, 1990-3, 1995-7 [Computer file] (Vol. 2000). Ann Arbor, MI: Institute for Social Research [Producer]; Inter-university Consortium for Political and Social Research [Distributor]. • Li, Y., & Heath, A. F. (2008). Socio-Economic Position and Political Support of Black and Ethnic Minority Groups in the United Kingdom, 1972-2005 [computer file]. 2nd Edition. Colchester, Essex: UK Data Archive [distributor], SN: 5666. • University of Essex, & Institute for Social and Economic Research. (2009). British Household Panel Survey: Waves 1-17, 1991-2008 [computer file], 5th Edition. Colchester, Essex: UK Data Archive [distributor], March 2009, SN 5151.
References • Agresti, A. (2002). Categorical Data Analysis, 2nd Edition. New York: Wiley. • Blossfeld, H. P., Mills, M., & Bernardi, F. (Eds.). (2006). Globalization, Uncertainty and Men's Careers: An International Comparison. Cheltenham: Edward Elgar. • Lambert, P. S., & Gayle, V. (2009). Data management and standardisation: A methodological comment on using results from the UK Research Assessment Exercise 2008. Stirling: University of Stirling, Technical paper 2008-3 of the Data Management through e-Social Science research Node (www.dames.org.uk) • Long, J. S. (2009). The Workflow of Data Analysis Using Stata. Boca Raton: CRC Press. • Simpson, L., & Akinwale, B. (2006). Quantifying Stablity and Change in Ethnic Group. Manchester: University of Manchester, CCSR Working Paper 2006-05. • Stevens, S. S. (1946). On the theory of scales of measurement. Science, 103, 677-680. • Treiman, D. J. (2009). Quantitative Data Analysis: Doing Social Research to Test Ideas. New York: Jossey Bass. • van Deth, J. W. (2003). Using Published Survey Data. In J. A. Harkness, F. J. R. van de Vijver & P. P. Mohler (Eds.), Cross-Cultural Survey Methods (pp. 329-346). New York: Wiley.