Download
1 / 4
40 likes | 47 Views
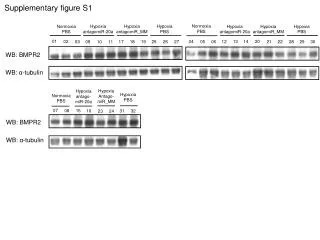
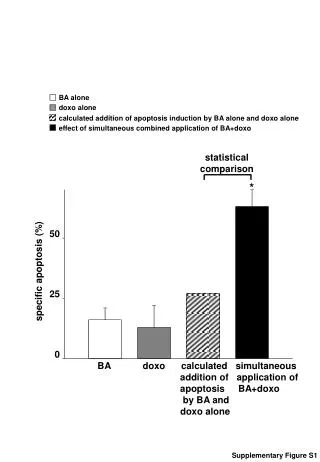
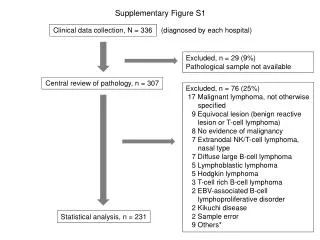
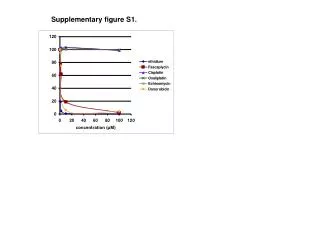
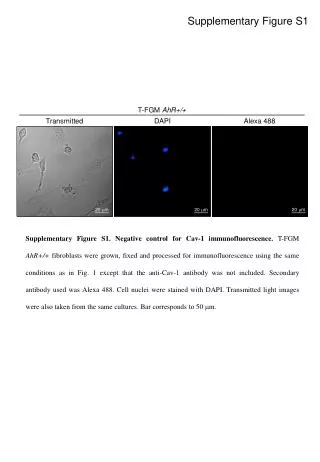
Supplementary Figure S1 Change of reporter activity levels after actinomycin D treatment. HEK293T cells were transiently transfected with the reporter and incubated with actinomycin D for the indicated times.

E N D
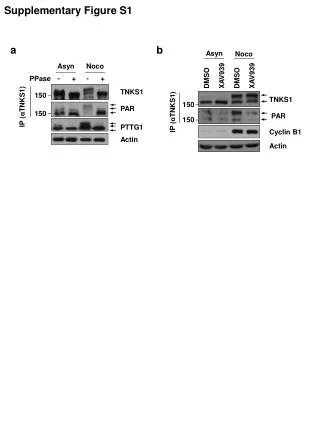
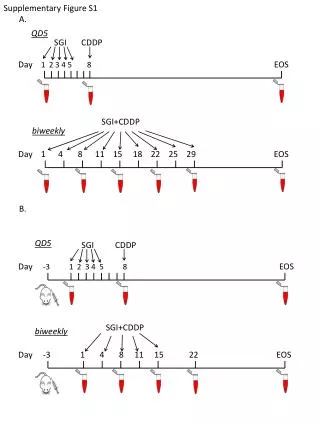
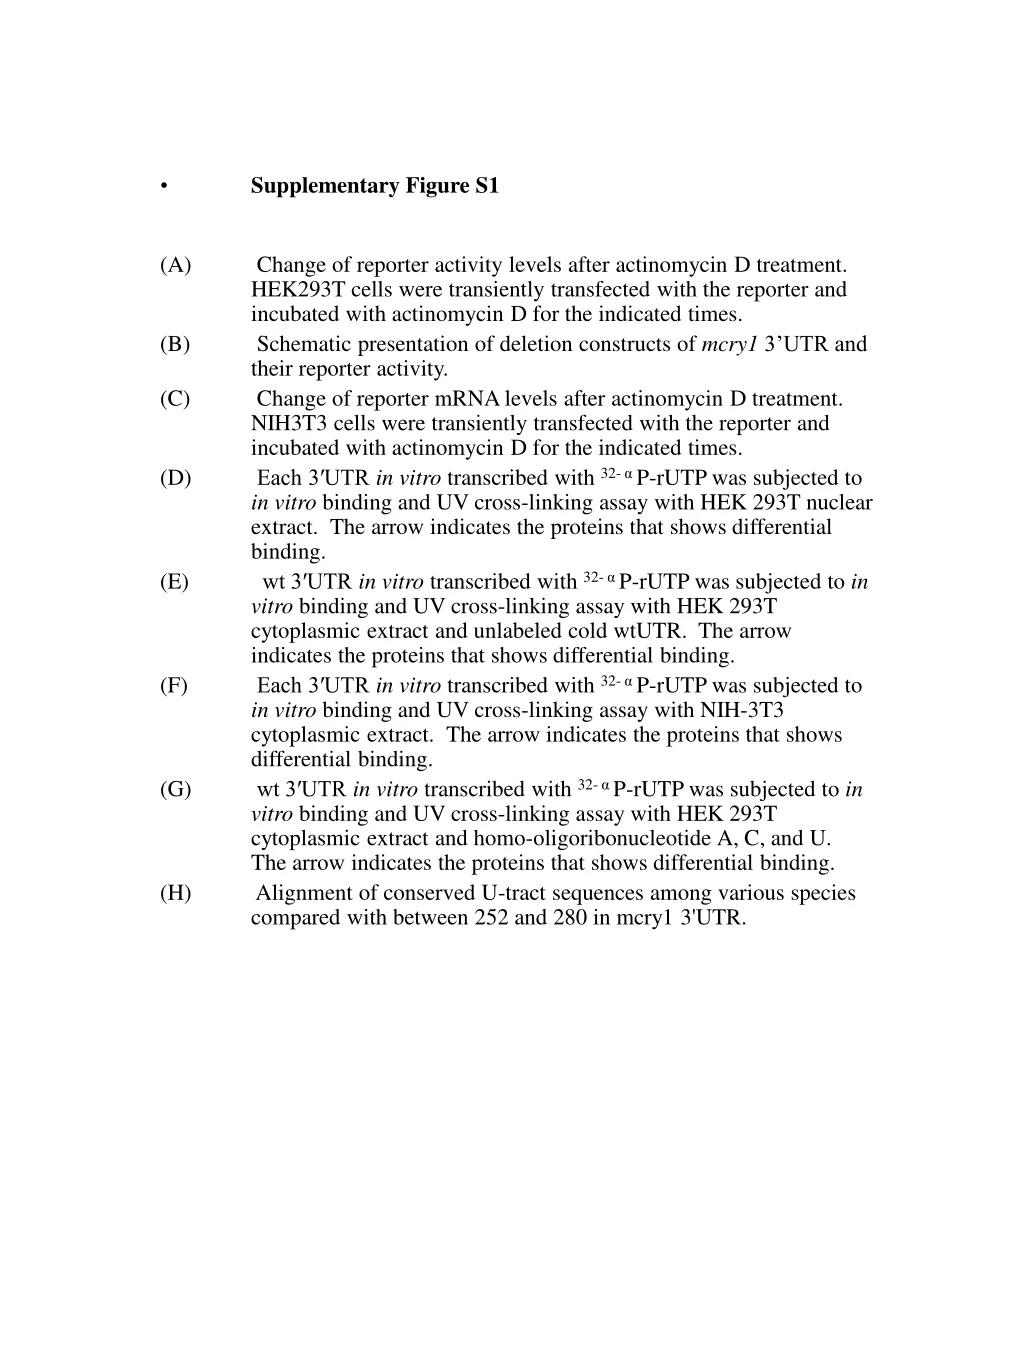
Supplementary Figure S1 • Change of reporter activity levels after actinomycin D treatment. HEK293T cells were transiently transfected with the reporter and incubated with actinomycin D for the indicated times. • Schematic presentation of deletion constructs of mcry1 3’UTR and their reporter activity. • Change of reporter mRNA levels after actinomycin D treatment. NIH3T3 cells were transiently transfected with the reporter and incubated with actinomycin D for the indicated times. • Each 3′UTR in vitro transcribed with 32- αP-rUTP was subjected to in vitro binding and UV cross-linking assay with HEK 293T nuclear extract. The arrow indicates the proteins that shows differential binding. • wt 3′UTR in vitro transcribed with 32- αP-rUTP was subjected to in vitro binding and UV cross-linking assay with HEK 293T cytoplasmic extract and unlabeled cold wtUTR. The arrow indicates the proteins that shows differential binding. • Each 3′UTR in vitro transcribed with 32- αP-rUTP was subjected to in vitro binding and UV cross-linking assay with NIH-3T3 cytoplasmic extract. The arrow indicates the proteins that shows differential binding. • wt 3′UTR in vitro transcribed with 32- αP-rUTP was subjected to in vitro binding and UV cross-linking assay with HEK 293T cytoplasmic extract and homo-oligoribonucleotide A, C, and U. The arrow indicates the proteins that shows differential binding. • Alignment of conserved U-tract sequences among various species compared with between 252 and 280 in mcry1 3'UTR.
NAT activity 0 20 40 60 80 100 120 CMV NAT pcNAT mcry1_3′UTR 1 pcNAT_wt610 140 201 120 401 100 pcNAT 80 AANAT activity (%of Act.D 0h) 610 pcNAT_wt610 60 1.2 pcNAT_N201 40 1.0 20 pcNAT_N401 0.8 0 Act.D 5h Act.D 0h Relative mRNA level (aanat/rpl32) 0.6 0.4 pcNAT-N401 0.2 pcNAT-N201 0.0 0 2 4 6 Time after Act.D [h] Woo et al_ Supplementary Fig. S1 A B C
mCry1_3′UTR HEK_cyto + + + + homopolymer A C U 115 115 90.5 61.5 90.5 + + + HEK_nuc 61.5 wt610 + N201 + 46.2 46.2 + N401 37.5 115 37.8 90.5 + + + + + + NIH_cyto HEK_cyto 61.5 wt610 wt610 + + + + N201 + + Cold N401 46.2 115 37.5 90.5 61.5 46.2 37.5 Woo et al_ Supplementary Fig. S1 D E G F H
Supplementary Table primer sequences for real time PCR