Download
1 / 7
70 likes | 188 Views
Supplementary figure S1. Supplementary figure S2. A. B. DNA replication %. DNA replication %. NU. EB+NU. EB. ctl. 20’ 60’. 20’ 60’. 20’ 60’. 20’ 60’. cdc45. RPA. PCNA. MCM3. Supplementary figure S3. A. B. DNA replication %. Supplementary figure S4. % DNA replicated.

E N D
Supplementary figure S2. A B DNA replication % DNA replication %
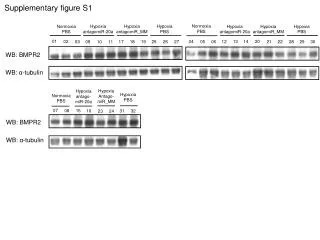
NU EB+NU EB ctl 20’ 60’ 20’ 60’ 20’ 60’ 20’ 60’ cdc45 RPA PCNA MCM3 Supplementary figure S3. A B DNA replication %
Supplementary figure S4. % DNA replicated
Supplementary figure S5. DNA replication %
Supplementary figure S6. - 5 20 60 ℗-MCM2 MCM7 Cdc45 RPA
Supplementary figure S8. Supplementary figure S7. EB 50µM CTL EB 90’ 30’ Ctl 90’ 10min 45min 10min 45min DNA DNA Lamin B3 DHCC