Download
1 / 5
50 likes | 161 Views
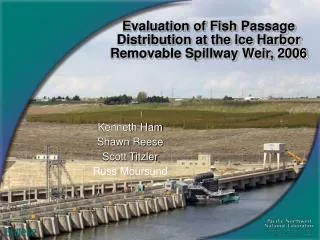
Passage Behavior and Survival for Radio-tagged Subyearling Chinook Salmon at Ice Harbor Dam, 2006. Darren A. Ogden. Fish Ecology Division Northwest Fisheries Science Center NOAA Fisheries Service and U. S. Army Corps of Engineers Northwestern Region Walla Walla District.

E N D
Passage Behavior and Survival for Radio-tagged Subyearling Chinook Salmon at Ice Harbor Dam, 2006 Darren A. Ogden Fish Ecology Division Northwest Fisheries Science Center NOAA Fisheries Service and U. S. Army Corps of Engineers Northwestern Region Walla Walla District
2006 Results:Passage distribution Flow JBS T1 T2 T3 T4 T5 T6 S1 rsw S3 S4 S5 S6 S7 S8 S9 S10 Spillway Powerhouse
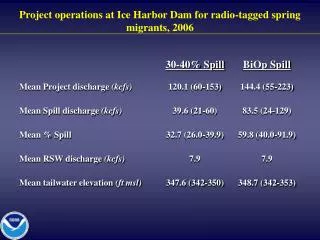
Fish Passage Efficiency 98.2% (96.95 – 99.45%) Spill Efficiency 94.0% (91.77 – 96.23%) Spill Effectiveness 2.01 (1.98 – 2.04) RSW Effectiveness 4.56 (4.50 – 4.62) Training Spill Effectiveness 0.82 (0.78 – 0.86) Fish Guidance Efficiency 70.4% (52.83 – 87.97%) 2006 Results:Passage metrics
Relative Survival S.E. 95% C.I. Dam (forebay BRZ to tailrace) 0.952 0.006 0.938 – 0.967 Concrete (all fish passing the dam) 0.977 0.006 0.962 – 0.992 Spillway (fish passing through the spillway) 0.988 0.006 0.975 – 1.001 RSW (fish passing only through the RSW) 0.980 0.008 0.961 – 0.999 2006 Results: Relative survival
2006 Results Summary • 75% of the fish approached the RSW area first (spill bays 1-3). • 94% of the fish passed through the spillway. 68% through the RSW. • Forebay residence time was shorter than previous years (2 hours). • Passage metrics: all high • RSW efficiency: increased % spill, decreased % efficiency. • Tailrace egress time was less than 11 minutes. • All relative survival estimates for actively migrating subyearling Chinook salmon were high.