Download

1 / 23
230 likes | 315 Views
Snake River Fall Chinook Salmon Productivity and Hatchery Production. What do we mean by “Productivity”. Measure of a population’s ability to replace itself. “Population growth rate” “Trend in Abundance” is the manifestation of long-term population growth rate

E N D
Snake River Fall Chinook Salmon Productivity and Hatchery Production
What do we mean by “Productivity” • Measure of a population’s ability to replace itself. • “Population growth rate” • “Trend in Abundance” is the manifestation of long-term population growth rate • Incorporates life stage specific survival, fecundity, age structure, and behavior
Presentation Outline • Trends in Abundance • Hatchery Production • Management Actions • Critical Uncertainties
Snake River Fall Chinook Salmon Population and ESU Structure One remaining population Lyons Ferry Hatchery genetics very similar to natural-origin (endemic brood program) Reduced distribution within assessable habitat Two extinct populations Marsing Reach Salmon Falls
Average Adult Returns to Snake River Basin by Decade = Natural/wild Origin = Hatchery Origin
Estimated Return of Fall Chinook Adult Returns to Lower Granite Dam, 1975-2007 Draft Escapement Goal = 39,110 = Natural Origin = Hatchery Origin = Out-of-Basin Hatchery Strays
Abundance and Productivity MetricsICTRT 12-21-06 Draft Assessment
Number of Fall Chinook Redds Counted above Lower Granite Dam, 1988-2007 First Adult Returns from Supplementation
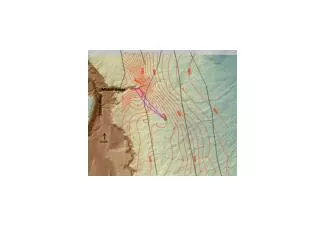
Overall distribution of redds upstream of Lower Granite Reservoir (1988 – 2006 Average ) Imnaha 2.7% Salmon 0.7% Grande Ronde 8.0% Clearwater 24.3% Snake 64.3%
Snake River Fall Chinook Salmon Hatchery Production • Past • Egg bank program – Kalama/Hagerman 1976-1984 • Lyons Ferry releases below Granite 1984-1994 (LSRCP Mitigation) • Present • USvOR dispute, releases above Lower Granite Dam, FCAP acclimation 1995-present • NPTH 2003 – Present • IPC Mitigation • Future • US v OR Agreement TBD
Hatchery Facilities and Release Locations Nez Perce Tribal Hatchery Oxbow Hatchery
Estimated Return of Fall Chinook Adult Returns to Lower Granite Dam, 1975-2007 First Adult Returns from Supplementation ICTRT minimum viability threshold = 2,500
What We Do Know • Increases in abundance and productivity have occurred, but the extent to which those improvements in overall life-cycle survival effects on fall Chinook salmon will be maintained and can be attributed to recent changes in management vs merely reflective of improvements in ocean productivity is uncertain. • Hatchery releases upstream of Lower Granite Dam have increased the abundance of spawners in natal habitat, with assumed contribution to increased production.
What We Do Know (cont.) • Adult abundance via annual run-reconstruction of fish to Lower Granite Dam. • Natural-origin adult abundance near delisting criteria. • Total abundance is well below historic levels and current management goals. • Adult distribution via annual aerial redd counts. • 70/30 rule between Snake and Clearwater. • Mainstem state and tribal harvest via coded-wire tag recoveries and creel surveys.
Things We Don’t Know • Contribution/influence of hatchery fish on natural productivity. • Long-term viability of an ESU with only a single extant population spatial structure and diversity. • Extant and extirpated habitat carrying capacity. • Estimates of annual juvenile abundance / production. • Survival rates for hydrosystem passage routes or operational strategies. • Role of juvenile life history diversity.