Download
1 / 12
120 likes | 228 Views
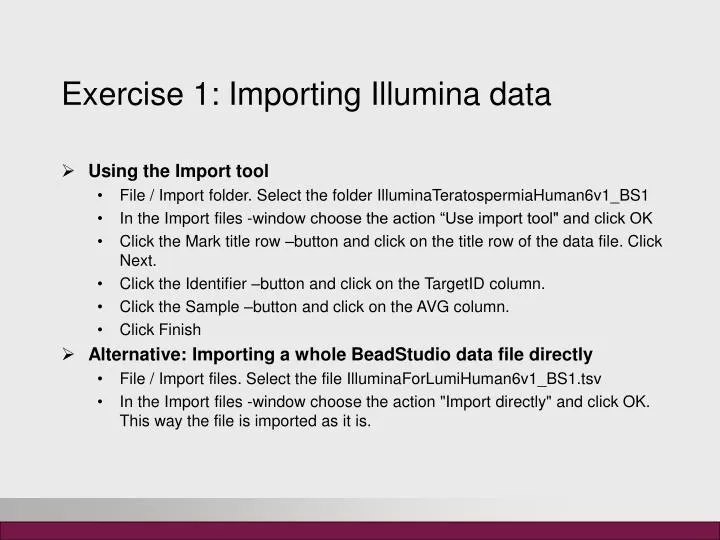
Exercise 1: Importing Illumina data. Using the Import tool File / Import folder. Select the folder IlluminaTeratospermiaHuman6v1_BS1 In the Import files -window choose the action “Use import tool" and click OK

E N D
Exercise 1: Importing Illumina data • Using the Import tool • File / Import folder. Select the folder IlluminaTeratospermiaHuman6v1_BS1 • In the Import files -window choose the action “Use import tool" and click OK • Click the Mark title row –button and click on the title row of the data file. Click Next. • Click the Identifier –button and click on the TargetID column. • Click the Sample –button and click on the AVG column. • Click Finish • Alternative: Importing a whole BeadStudio data file directly • File / Import files. Select the file IlluminaForLumiHuman6v1_BS1.tsv • In the Import files -window choose the action "Import directly" and click OK. This way the file is imported as it is.
Exercise 2: Normalizing Illumina data • Using the IlluminaTeratospermiaHuman6v1_BS1 dataset (separate files) • In the workflow view, double click on the box ”13 files” to select all of them • In the analysis tool section, choose Normalization and Illumina • Click Show parameters and set the chiptype to Human-6v1 • Click Run • Repeat the run using the same chiptype, but setting the normalize.chips to none. • Using the file IlluminaForLumiHuman6v1_BS1.tsv (one whole BS file) • Select the file IlluminaForLumiHuman6v1_BS1.tsv • Choose Normalization and Illumina – lumi pipeline • Click Show parameters and set the chiptype to Human-6v1 • Click Run • Repeat the run using the same chiptype, but setting the normalize.chips to none.
Exercise 3: Describe the experiment • Using the IlluminaTeratospermiaHuman6v1_BS1 dataset (separate files) • Double click the phenodata file • In the phenodata editor, enter 1 in the group column for the control samples and 2 for the affected samples • Using the file IlluminaForLumiHuman6v1_BS1.tsv (one whole BS file) • Double click the phenodata file • In the phenodata editor, click on the original name –column to sort the samples. In the group column mark the replicates with the same number (1, 2 and 3)
Exercise 4: Illumina quality control • Using the IlluminaTeratospermiaHuman6v1_BS1 dataset • Run the tools Statistics / NMDS and Visualization / Dendrogram for both the normalized and the ”mock-normalized” data files • View the result files side by side (use the Detach button) • Using the IlluminaForLumiHuman6v1_BS1.tsv dataset • As above
Exercise 5: Filtering • Select the normalized data and play with different filters • Preprocessing / Filter by SD • Preprocessing / Filter by CV • Preprocessing / Filter by IQR
Exercise 6: Statistical testing • t-test • Select the sd-filter.tsv of the teratospermia dataset • Run Statistics / Two group test using the method t-test • Empirical Bayes • Select the normalized.tsv of the teratospermia dataset • Run Statistics / Two group test using the method empirical Bayes and turning the P-value adjustment off • Run Preprocessing / Filter by SD on the result file two-group.tsv • Run Statistics / Adjust P-values on the result file sd-filter.tsv (you have to specify the P-value column in the parameters) • Compare the results using the Venn diagram • Save the analysis session • File / save session
Exercise 7: Linear modelling - taking several covariants into account at the same • Use a kidney cancer dataset of 17 samples • Start a new session • File / Import folder, select the folder AffyNormalized and Import directly • Right-click the normalized.tsv and link it to the phenodata.tsv. Look what columns you have in the phenodata. • Linear modelling • Select the normalized.tsv and Statistics / Linear modelling. Set group, kidney side and gender as the three main effects. Set donor as the pairing information. • Select the result file pvalues.tsv and run the tool Utilities / Extract genes using a P-value for all the main effect P-value columns (= three times) • Save the session
Exercise 8: Clustering • Open your Illumina session • Hierarchical clustering • Select the adjust-pvalues.tsv • Run Clustering / Hierarchical with default parameters. • Repeat the run using bootstrapping: Set the resampling parameter to bootstrap and number of replicates to 10. • How reliable are the branches? • K-means clustering • Select the adjust-pvalues.tsv • Run the tool ”K-means – estimate K” • Run K-means clustering setting the parameter number of clusters according to your estimated K. • View the clusters using the visualization method Expression profiles • Extract the genes from cluster 1 using Utilities / Extract genes from clustering
Exercise 9: Annotation • Annotate genes • Select the file adjust-pvalues.tsv • Run Annotation / Illumina gene list • Open the result file annotations.html and click the links in the gene and pathway columns to read more about one of the genes • Open the result file annotations.tsv and sort it by the pathway column. Slide the pathway column next to the description column and make it wider
Exercise 10: Pathway analysis • Gene enrichment analysis • Select the file adjust-pvalues.tsv • Run Pathways / Hypergeometric test for KEGG • Are any KEGG pathways enriched in your list of differentially expressed genes? • Using the file annotations.tsv, figure out what are the genes that contributed to the top pathway • Gene set test • Select the file normalized.tsv • Run Pathways / Gene set test and set the parameter pathways.or.genelist to KEGG.
Exercise 11: Promoter analysis • Pattern discovery: do the promoters of similarly expressed genes share a sequence motif? • Select the file extract.tsv containing the genes from cluster 1 • Run Promoter analysis / Weeder. What is the most interesting motif? Check in the matrix (Best occs) what positions are most conserved. • Run Promoter analysis / Cosmo. As judged by the sequence logo, do you find similar motifs?
Exercise 12: Saving and running a workflow • Save a workflow • Prune your teratospermia dataset workflow if necessary • Select the file normalized.tsv and click on the Workflow / Save starting from selected. Give your workflow a meaningful name and save it. • Run a workflow • Open the session called sessionIlluminaTeratospermia.cs • Select the file normalized.tsv and Workflow / Run recent