Download
1 / 42
420 likes | 599 Views
CS 551 – Software Life Cycle. Key Question. What’s the problem?. “…[I]n software there has always been a great willingness to make changes in the specifications, and this makes the job tenuous; hardware people have a habit of freezing a design and not letting a

E N D
Key Question What’s the problem?
“…[I]n software there has always been a great willingness to make changes in the specifications, and this makes the job tenuous; hardware people have a habit of freezing a design and not letting a large number of new things be incorporated into it. When you allow changes you risk errors, delays and cost overruns.” R.W. Hamming, preeminent software philosopher Journal of Systems Integration, Vol. 6, Number 1/2, March 1996, Kluwer Academic Publishers Boston ISSN: 0925-4676, p. 6
Software Requirements Process • Requirements Elicitation • Requirements Analysis • Use Cases • Requirements Specification • Prototype • Requirements Management
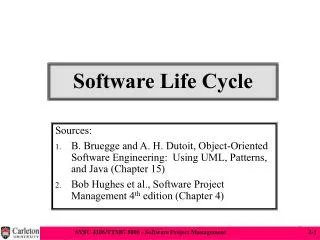
Five Great Processes Solo Virtuoso Code Ownership Engage QA Divide and Conquer Prototype Reference: Technical Memorandum by J. O. Coplien Document No. BL0112650-940906-50TM
30% 45% 25% Product Size Reduction TRADITIONAL PROCESS PROTOTYPING Systems Engineering & Prototype Systems Engineering 20% Final Development Design, Develop, Test, Install 80% Deployment Final Development, Deployment 40% 40% REDUCTION
‘Code then fix’ Fix Code Test Run This approach leads to unstructured, unstable software that sometimes meets users’ needs. Problems are hard to find and harder to fix.
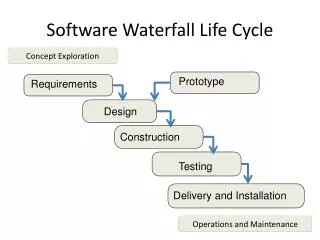
Analysis Design Coding Testing Integration The Waterfall Model • Document Focused • Phases in lockstep • Encourages point solutions • Mistakes found late • Leads to tightly coupled systems
The Spiral Model Analysis Design • Risk Focused • Incremental and iterative • Evolutionary Feature Discovery • Prototyping with quick feedback • Continuous integration Coding Testing
Extreme Programming (XP) • Test before Coding • Pair Programming • On-Site Customers • Ad hoc functionality • Evolutionary Development • Continuous Integration • Short Cycles with Feedback • Incremental Development
People Process Product Project (control, risk, schedule, trustworthiness) Technology and Platforms (rules, tools, assets) People work days, computers work nights Work, not people, needs to be mobile Productivity must continue to double with no loss of reliability or performance Vision
Customer Interests I N S T A L L A T I O N • Before • Features • Price • Schedule • After • Reliability • Response Time • Throughput
Why bad things happen to good systems • Customer buys • off-the-shelf • System works • with 40-60% • flow- through • Developers complies • with enhancements • Customer refuses • critical Billing • Module • Customer demands • 33 enhancements • and tinkers with • database • Unintended • system • consequences BUT
One common process is not the goal Commonly managed processes are possible Scalability is essential Lessons Learned
Brooks: System Production x3 Program Programming System x3 Programming System Product Programming Product x9
Techniques for Project Planning • Some sort of work breakdown structure, tasks into subtasks with constraints • Beware of over and under analysis • Beware of diffuse responsibility • Gantt chart - Microsoft project (do not represent dependencies between activities) • Identify critical path activities (should know w/o automation) • Sensitivity analysis - “what if” questions • Also informal methods -- milestones
Move from a culture of minimal change to one of maximal change. Move to "make it work, make it work right, make it work better" philosophy through prototyping and delaying code optimization. Give the test teams the "right of refusal" for any code that was not reasonably tested by the developers. Mindset
Productivity = F {people, system nature, customer relations, capital investment} Productivity As of 8/31/06
20:1 difference between people but ‘20:1ers’ are 1% of population Code ownership with one developer making module changes; apprentice permitted Source module size = 20-40 new function points; smaller modules carry too much overhead; larger modules become too big for people to understand Production module size - constrained only by the execution environment People 20:1
If Report Generation Software =1, then On-line Software =5, and Communications or Real-time =10 1:5:10 is the degree of difficulty or complexity which impacts productivity System Nature 10:5:1
Projects that team with customers are twice as productive as those that have contracts Prototypes build customer relations and increase productivity by 40%. Customer Relations 2:1
100:1 improvement every 20 years measured by the expansion factor OOT coming with 3:1 potential Objects in the large, and 80% reuse by turn of the century Capital Investment
20 18 16 14 12 80 Projects 10 98 Projects 8 6 4 2 0 IDMS IMS MVS Oracle UNIX VM Composite Function Point Metric Function Points/Staff Month Technology
Objects Benefits of Objects: 1. Manages complexity 2. Speeds development 3. Encourages module reuse 4. Enables scaling Prerequisites for Supporting Object-Oriented Design: 1. Software technologies and techniques 2. Tools and infrastructure 3. Management process and culture 4. Know-how
Trends in Software Productivity Expansion Factor The ratio of Source line of code to a machine level line of code Order of Magnitude Every Twenty Years Technology Change: Machine Instructions Macro Assemblers High Level Languages Database Managers On-Line Dev Prototyping Subsec Time Sharing Object Oriented Programming Large Scale Reuse Regression Testing 4GL Small Scale Reuse Each date is an estimate of widespread use of a software technology
Revisiting Software Engineering Economics Barry Boehm USC Center for Systems and Software Engineering Keynote Address, EQUITY 2007 March 19, 2007
Implications for the future • Estimation • Value-based approaches • Agility • Systems-of-Systems
Software Estimation: 1980’s Expectations Estimation Error Prece- dented Unprece- dented Domain Understanding
Software Estimation: The Receding Horizon RAD: Rapid Application Development Relative Productivity Estimation Error Open Source Unprece- dented Component- based Systems of Systems Prece- dented RAD A B C D Domain Understanding
The Future of Systems and Software • Eight surprise-free trends • Increasing integration of SysE and SwE • User/Value focus • Software Criticality and Dependability • Rapid, Accelerating Change • Distribution, Mobility, Interoperability, Globalization • Complex Systems of Systems • COTS, Open Source, Reuse, Legacy Integration • Computational Plenty • Three surprises • Autonomy and Adaptable Software • Combinations of Biology and Computing • Multi-threading returns
Pareto 80-20 distribution of test case value [Bullock, 2000] Actual business value
Defect Removal Estimates - Nominal Defect Introduction Rates Delivered Defects / KSLOC Composite Defect Removal Rating
Trustworthy Trends • Software increasingly success-critical to product and services • Provides competitive differentiation, adaptability to change • Dependability is generally not vendors’ top-priority • “The IT industry spends the bulk of its resources… on rapidly bringing products to market.” – US PITAC Report • By 2025, there will be a “9/11” – magnitude software failure that will raise trustworthiness to priority 1 • Major loss of life or collapse of world financial system • Market demand; stronger warranties and accountability • Value-based trustworthy processes and tools • But other trends will make trustworthy solutions harder • System complexity, globalization, rapid change