Download
1 / 7
70 likes | 281 Views
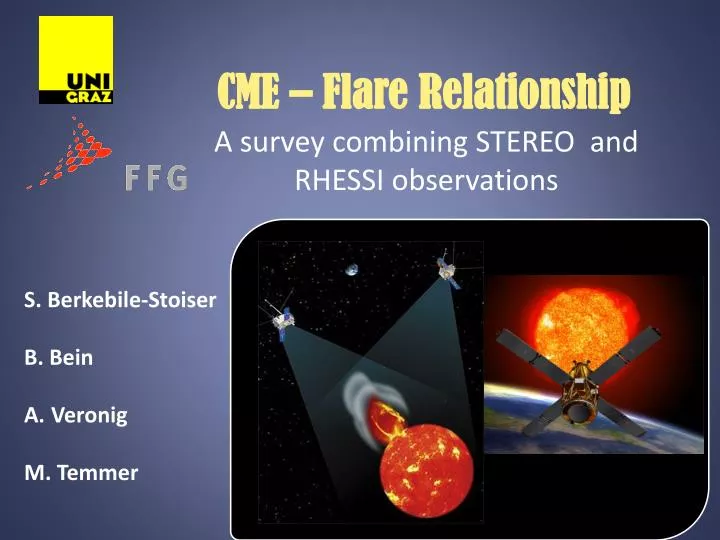
CME – Flare Relationship. S. Berkebile-Stoiser B. Bein Veronig M. Temmer. A survey combining STEREO and RHESSI observations. Aims. Study on a statistical basis : dynamics of CMEs ( full acceleration profile )

E N D
CME – Flare Relationship • S. Berkebile-Stoiser • B. Bein • Veronig • M. Temmer A surveycombining STEREO and RHESSI observations
Aims • Study on a statisticalbasis: • dynamicsof CMEs (fullaccelerationprofile) • relationtotheenergyrelease in theassociatedflare (highenergyparticles ) • relationoftheCME sourceregiontotheassociatedflares‘ energyrelease (location, size, magneticfieldtopology)
Data • CME Data: • STEREO : - EUVI: 171 Å, 195 Å (cadence ≤ 2.5 min) • - Cor 1, Cor 2 WL coronagraphs • (cadence: ~2.5 min – 15 min ) • →FoV: 1 – 15 RΘ • Flare Data: - RHESSI:flare X-rayemission > 3 keV (cadence: ~4s) • - GOES: 0.5 – 8 Å
Data Products Goal:determinethekinematicsofat least 50 CMEs • Time distancecurveofthe CME leadingedge →velocity/accelerationprofile • Peak velocity, peakacceleration • Duration of impulsive accelerationphase • Height ofinitiation, peakand end ofacceleration Flares:comparisonwith RHESSI lightcurves, peakspectra
Event Selection Qualitative classification of Cor 1 CMEs: → GOES class: ~80% A and B, ~17% C, ~3% M flares
CME March 25, 2008 • Automatic detection of the CME leading edge: • normalization, unsharp masking (EUVI), • NRGF filter • Determination of CME front in difference images: • - Iteratively searching for contours at increasing `intensity levels‘ -> distance of pixels from sun center • Stop when mean distance of the pixels on 2 level contours are similar a ≈ 410 m s-2 12-25 keV 25-50 keV movie
Problems: - associationofflaresand CMEs oftenambigous - correctidentificationof LE in firstCor 1 image - numerical derivative method - … Thankyouforyourattention!