Download
1 / 11
130 likes | 379 Views
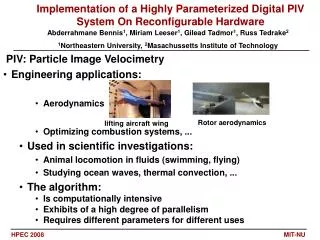
Particle Image Velocimeter. Conventional methods (HWA, LDV) Single-point measur em ent Traversing of flow domain Time consuming Only turbulence statistics. Particle image velocimetry Whole-field method Non-intrusive (seeding) Instantaneous flow field. Why use imaging?.

E N D
Conventional methods (HWA, LDV) Single-point measurement Traversing of flow domain Time consuming Only turbulence statistics Particle image velocimetry Whole-field method Non-intrusive (seeding) Instantaneous flow field Why use imaging? After: A.K. Prasad, Lect. Notes short-course on PIV, JMBC 1997
Coherent structures in a TBL Kim, H.T., Kline, S.J. & Reynolds, W.C. J. Fluid Mech. 50 (1971) 133-160. Smith, C.R. (1984) “A synthesized model of the near-wall behaviour in turbulent boundary layers.” In: Proc. 8th Symp. on Turbulence (eds. G.K. Patterson & J.L. Zakin) University of Missouri (Rolla).
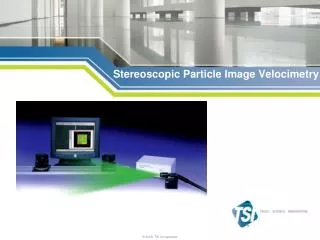
PIV optical configuration Multiple Flashes Of Light Laser Sheet
Velocity from tracer motion Prob(detect) ~ image density (NI) Low image density NI << 1 Particle tracking velocimetry High image density NI >> 1 Particle image velocimetry
PIV Interrogation analysis RP RD+ RD- RC+RF Double-exposure image Spatial correlation Interrogation region
PIV result Turbulent pipe flow Re = 5300 100×85 vectors “Hairpin” vortex
Inherent assumptions • Tracer particles follow the fluid motion • Tracer particles are distributed homogeneously • Uniform displacement within interrogation region
“Ingredients” FLOW sampling seeding quantization Pixelization illumination enhancement Acquisition imaging selection registration correlation Interrogation estimation RESULT analysis validation