Download
1 / 36
360 likes | 535 Views
Preview. What does Recombination do to Sequence Histories. Probabilities of such histories. Quantities of interest. Detecting & Reconstructing Recombinations. Haploid Reproduction Model (i.e. no recombination). 1. 1. 2. 2. 3. 3. 2N. 2N.

E N D
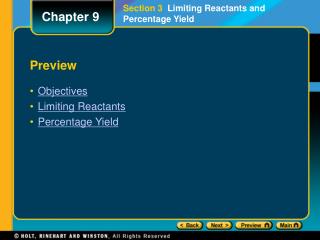
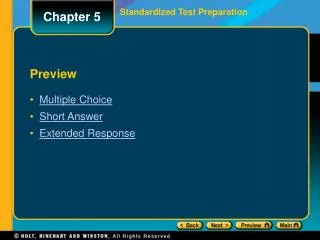
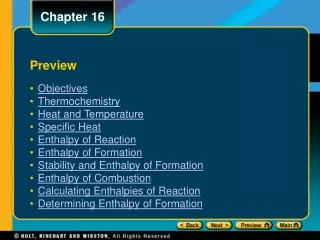
Preview What does Recombination do to Sequence Histories. Probabilities of such histories. Quantities of interest. Detecting & Reconstructing Recombinations.
Haploid Reproduction Model(i.e. no recombination) 1 1 2 2 3 3 2N 2N Individuals are made by sampling with replacement in the previous generation. The probability that 2 alleles have same ancestor in previous generation is 1/2N. The probability that k alleles have less than k-1 ancestors in previous generation is vanishing.
1 4 2 3 0 recombinations implies traditional phylogeny
1 2 Nm Diploid Model with Recombination Females Males 1 2 Nf 1 2 Nm 1 2 Nf
The Diploid Model Back in Time. A recombinant sequence will have have two different ancestor sequences in the grandparent.
1- recombination histories I: Branch length change 1 2 4 3
1- recombination histories IV:Coalescent time must be further back in time than recombination time. c r 1 2 4 3
Summarising new phenomena in recombination-phylogenies Consequence of 1 recombination Branch length change Topology change No change Time ranking of internal nodes Multiple Ancestries Non-ancestral bridges What is the probability of different histories?
Coalescence +Recombination (Hudson(1983)) r = probability for a recombination within a dinucleotide pr. generation. r= r*(L-1)*4N= Expected number of recombinations/(gene*4N generations). 1.Waiting time backward until first recombination is expo(r) distributed. ex. gene 1000 bp r = 10-8 , N = 104, generation span 30 years. Waiting time for a recombination/coalescence: 105/2*104 generations. 2. The position will be chosen uniformly on the gene.
Recombination-Coalescence Illustration Intensities Coales.Recomb. Copied from Hudson 1991 0 1 (1+b) b 3 (2+b) 6 2 3 2 1 2
Back-in-Time Process {1,2,4} {1,4} {Ø} {1,4} {1,2,4} {Ø} {5} 1 2 {1,2,4} {Ø} {Ø} {5} k Coalescent: Coalescent: {1,4} {1,2,4} {5} {1,2,4} {Ø} {1,4} {6} {5,6} {Ø} {6} {1,2,4,6} Two kinds of operations on sequence sets going backward in time. Each sequence is consists of intervals and each interval is labelled with subsets of {1,..,k} - possibly the empty set. A recombination takes one sequence and a position and generates two sequences: Example: Rates: Recombination: r*length of red
1 2 3 k Grand Most Recent Common Ancestor: GMRCA (griffiths & marjoram, 96) i. Track all sequences including those that has lost all ancestral material. ii. The G-ARG contains the ARG. The graph is too large, but the process is simpler. Sequence number - k. Birth rate: r*k/2 Death rate: E(events until {1}) = (asymp.) exp(r) + r log(n)
Properties of Neighboring Trees. (partially from Hudson & Kaplan 1985) /\ /\ / \ / \ / \ /\ \ /\ /\ /\ \ \ / \ / \ / \ \ \ 1 2 3 4 1 3 2 4 -------------!-------------- Leaves Root Edge-Length Topo-Diff Tree-Diff 2 1.0 2.0 0.0 .666 3 1.33 3.0 0.0 .694 4 1.50 3.66 0.073 .714 5 1.60 4.16 0.134 .728 6 1.66 4.57 0.183 .740 10 1.80 5.66 0.300 .769 15 1.87 6.50 0.374 .790 500 1.99 0.670
1 1 1 2 2 2 3 3 Old +Alternative Coalescent Algorithm Adding alleles one-by-one to a growing genealogy Old 1
Spatial Coalescent-Recombination Algorithm (Wiuf & Hein 1999 TPB) 1. Make coalescent for position 0.0. 2. Wait Expo(Total Branch length) until recombination point, p. 3. Pick recombination point (*) uniformly on tree branches. 4. Let new sequence coalesce into genealogical structure. Continue 1-4 until p > L.
Properties of the spatial process i. The process is non-Markovian * = * ii. The trees cannot be reduced to Topologies
MRCA How many Genetic Ancestors does a population have? No recombination Mitochondria Y-chromosome Recombination X + autosomal chromosomes Recombination- Coalescence Equilibrium: (Sample independent) MRCA at each position: (Sample dependent) Present sample:
Tracing one sequence back in time. From Wiuf & Hein 1997
One realisation of a set of ancestors 5 4 3 2 1 5 4 3 5 2 4 1 3 2 1 Number of Ancestors seen as function of sequence length: Number of Segments seen as function of sequence length: 7 6
Number of ancestors to the Human Genome Sr– number of Segments Lr – amount of ancestral material on sequence 1. r = 4Ne*r – Ne: Effective population size, r: expected number of recombinations per generation. Theoretical Results E(Sr) = 1 + r E(Lr) = log(1+r) P(number of segments in [0, r]) as r -->infinity) > 0 Applications to Human Genome Parameters used 4Ne 20.000 Chromos. 1: 263 Mb. 263 cM Chromosome 1: Segments 52.000 Ancestors 6.800 All chromosomes Ancestors 86.000 Physical Population. 1.3-5.0 Mill.
Gene Conversion Recombination: Gene Conversion:
Consequences of Recombination Incompatible Sites 0 0 0 1 1 1 1 0 Varying Divergence Along Sequence. ---------- ------------------ 1.5 0.4 ---------- ------------------ Convergence from high correlation to no correlation along sequence. Topology Shifts along sequences.
1 3 2 4 Compatibility 1 2 3 4 5 6 7 1 A T G T G T C 2 A T G T G A T 3 C T T C G A C 4 A T T C G T A i i i i. 3 & 4 can be placed on same tree without extra cost. ii. 3 & 6 cannot. Definition: Two columns are incompatible, if they are more expensive jointly, than separately on the cheapest tree. Compatibility can be determined without reference to a specific tree!!
Hudson’s RM (k positions can at most have (k+1) types without recombination) ex. Data set: A underestimate for the number of recombination events: ------------------- --------------- ------- --------- ------- ----- If you equate RM with expected number of recombinations, this would be an analogue to Watterson’s estimators. Unfortunately, RM is a gross underestimate of the real number of recombinations.
Recombination Parsimony Data 1 2 3 Trees T 1 2 i-1 i L Recursion:W(T,i)= minT’{W(T’,i-i) + subst(T,i) + drec(T,T’)} Fast heuristic version can be programmed.
Recombination Parsimony: Example - HIV Costs: Recombination - 100 Substitutions - (2-5)
Mutation Coalescence Recombination Data CTTCGAC ATTCGTA ATGTGTC ATGTGAT Likelihood approach to recombination Griffiths,Tavaré (1994), Griffiths, Marjoram (1996) & Fearnhead, Donnelly (2001) i. Probability of Data as function of parameters (likelihood) ii. Statements about sequence history (ancestral analysis) iii. Hypothesis testing iv. Model Testing
Likelihood approach to recombination (Griffiths, Marjoram (1996) )
Summary What does Recombination do to Sequence Histories. Probabilities of such histories. Quantities of interest. Detecting & Reconstructing Recombinations.