Download

1 / 48
770 likes | 1.55k Views
Decision Table Testing. Testing the Business Logic. Petar Horozov. Nikolay Nedyalkov. Senior QA Engineer. Senior QA Engineer. XAML Team 4. XAML Team 4. Telerik QA Academy. Table of Contents. Decision Table Testing – Main Concepts Decision Tables Creating Decision Tables

E N D
Decision Table Testing Testing the Business Logic Petar Horozov Nikolay Nedyalkov Senior QA Engineer Senior QA Engineer XAML Team 4 XAML Team 4 Telerik QA Academy
Table of Contents • Decision Table Testing – Main Concepts • Decision Tables • Creating Decision Tables • Collapsing Columns in Decision Tables • Cause-effect Graphs • Decision Table to Cause-effect Graph Transitioning
Table of Contents (2) • Combining Decision Tables With Other Techniques • Avoiding Combinatorial Explosions And Common Errors
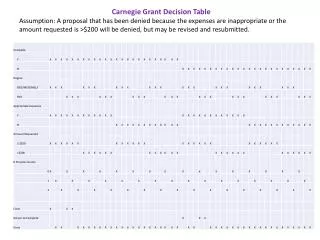
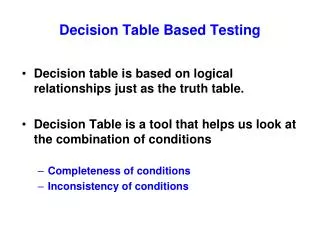
What is Decision Tables Testing? • Decision tables are a method for testing the business logic that lies underneath the user interface • Decision tables express the rules that govern handling of transactional situations
What is Decision Tables Testing? (2) • Transactional situations • Situations where the conditions that exist at a given moment are sufficient by themselves to determine the actions of the system • Decision tables testing connects combinations of conditions with the actions that should occur
Decision Tables Components • Components • Condition stubs • Interpreted as input • Condition entries • Restricted to binary values (limited entry table) • More than two values (extended entry table) • Action stubs • Interpreted as output • Action entries • Whether an action is to be performed
Decision Tables Components (2) • Example of decision table component structure :
The Decision Table Bug Hypothesis • What kind of bugs are we looking for? • Under some combination of conditions, a wrong action might occur • Some action that the system is not to take under this combination of conditions • Under some combination of conditions, the system might not take the right action • Not taking a required action
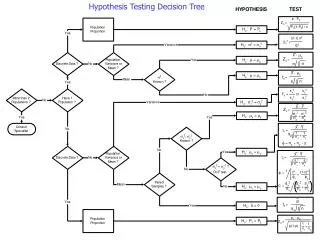
Table vs. Graph • The underlying model of decision table testing has two variations: • Table • More commonly used • Boolean graph • Less typical • If the graph is used, this technique is also referred to as a cause-effect graph
Creating Test Cases • Creating test cases with decision tables • Every rule (column) is replaced with concrete data values • Necessary preconditions are set • During test execution actual actions taken are compared to expected ones
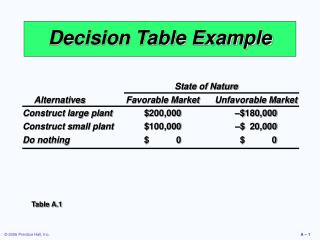
Business Rules • Each column in a decision table contains a business rule A single business rule
Business Rules (2) • Each businessrule says, in essence: "Under this particular combination of conditions - carry out this particular combination of actions."
The Coverage Criterion • The coverage criterion for decision tables is expressed by a simple rule: "One test per column in the decision table have to be derived."
Creating a Decision table • The number of columns (business rules) in a decision table is equal to 2n • For n = the number of conditions • Applied when conditions are strictly Boolean – true or false 2n = 8 n = 3
Creating a Decision table (2) • When conditions are not Boolean – extended decision table • Where x = number of possible condition entries xⁿ = ? n = 3
Conditions Population Pattern • Conditions in a decision table are populated using a simple pattern: • Half of the first row is filled with "Yes", the other half – with "No" • The second row is filled: first quarter "Yes", second quarter "No" … • … • The last row is filled: one cell "Yes", one cell "No" …
Conditions Population Pattern (2) • Conditions in a decision table are populated using a simple pattern:
Collapsing Columns in Decision Tables Reducing the Repetitive Test Rules
Collapsing Columns In a Decision Table • Not all columns in a decision table are actually needed • We can sometimes collapse the decision table, combining columns, to achieve a more concise decision table • Performed when the value of one or more particular conditions can't affect the actions for two or more combinations of conditions
Collapsing Columns In a Decision Table (2) • To combine columns – we should look for two or more columns that result in the same combination of actions
Collapsing Columns In a Decision Table (3) • In these columns – some of the conditions will be the same, and some will be different • Different ones don't seem to affect the outcome
Collapsing Columns In a Decision Table (4) • Each group of repetitive two (or more) columns can be combined in a single one 7 = 8 4 = 5
Collapsing Columns In a Decision Table (5) • Insignificant values are replaced with "–" (dash) • Means that any value can be used
A Little Hint • Combinable columns are often next to each other • Nevertheless this is not always the case
Cause-effect Graphs • Cause-effect graphs are graphical representations of the same rules, described via decision tables • They can be very helpful for assuring no mistakes are made in cases of collapsing decision tables • Cause-effect graphs can be converted from decision tables or created directly
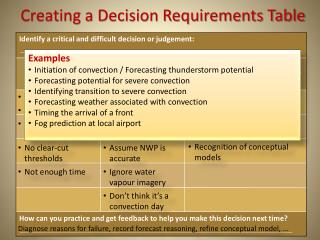
Table to Graph Transitioning • Creating a cause-effect graph from a decision table can be performed in a few steps: • List all the conditions on left of the blank page • List all the actions on the right of the page • Read the table to identify how combinations cause an action • Connect one or more conditions with each action using Boolean operators • Repeat for all actions
Cause-effect Graphs Legend • Interactions in cause-effect graphs are represented with Boolean operations according to the following legend: • A causes B • Not A causes B • A1 or A2 causes B • A1 and A2 causes B
Truth Tables • For fulfilling the coverage criterion for cause-effect graphs a "truth table" is generated • Contains all possible combinations of conditions • Serves for ensuring that one test for each row of the truth table is generated
Nonexclusive Rules • Sometimes more than one rule can apply to a transaction • Zero, one, several or all of the rules may be applied at the same time
Avoiding Combinatorial Explosions • "Combinatorial explosions" • Testing combinations of factors without consideration of the total count of those tests • Consider the amount of combinations before trying to test them all • How many combination exist for testing 3factors with 2 options each? • What about 6 factors with 5 options each? 23 = 8 56 = 15 625
Avoiding Combinatorial Explosions (2) • Combinatorial explosions can be avoided: • Identify the possiblecombinations • Use risk to weight those combinations • Test only the importantcombinations • Other techniques are also applicable: • Classification trees • Pairwise testing
Common Errors • Incompleteness • Not all conditions are covered • Contradiction • Two rules with the same conditions lead to different actions • Redundancy • Two rules with the same conditions lead to the same action • Ambiguity • A reduced table with contradictory and/or redundancy errors
Decision Table Testing Questions? ? ? ? ? ? ? ? ? ? ? ?
Exercises (1) • Below is a decision table for reservation of meeting room. Fill in the columns with true and false:
Exercises (2) • Below is a decision table for daily activities. Fill in the columns with true and false:
Exercises (3) • A store wishes to program a decision on non-cash receipts for goods into their intelligent tills. • The conditions to check are agreed as: • Transaction under £50 • Pays by cheque with cheque card (guarantee £50) • Pays by credit card • The possible actions that a cashier could take are agreed as:
Exercises (3) • Ring up sale • Call a supervisor • Automatic check of credit card company database Using the rules above construct a decision table showing all possible combinations of alternatives.
Resources • http://decisiontables.wikispaces.com/Types+of+Decision+Tables • http://www.cems.uwe.ac.uk/jharney/table.html • http://books.google.bg/books?id=yU-rTcurys8C&pg=PA133&dq=cause+effect+graphs&hl=en&sa=X&ei=PVPEUbC2HY7dsgaj14E4&ved=0CDgQ6AEwAg#v=onepage&q=cause%20effect%20graphs&f=false
Contacts • Nikolay Nedyalkov • email: nikolay.nedyalkov@telerik.com • Petar Horozov • email: petar.horozov@telerik.com