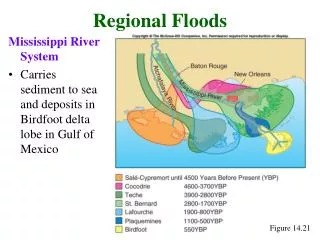
Download
1 / 14
140 likes | 257 Views
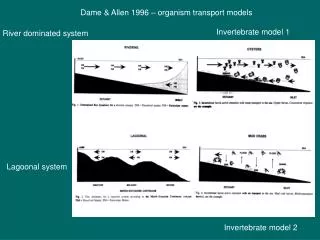
Dame & Allen 1996 – organism transport models. Invertebrate model 1. River dominated system. Lagoonal system. Invertebrate model 2. Odum et al. 1979 - Geomorphic driven export / import ecosystem model. Type I (A) –narrow inlet w/sill Type II (B) – moderate opening

E N D
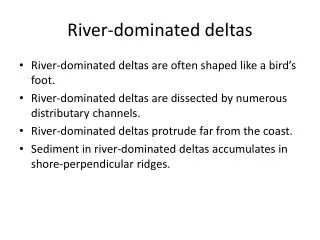
Dame & Allen 1996 – organism transport models Invertebrate model 1 River dominated system Lagoonal system Invertebrate model 2
Odum et al. 1979 - Geomorphic driven export / import ecosystem model Type I (A) –narrow inlet w/sill Type II (B) – moderate opening with small sill or barrier island Type III (C) – large opening with no sill
Dame et al. 1992 - Geohydrologic continuum export / import model Approach links morphology & hydrology Distance from inlet important Which relates to age The 2 approaches do not Always coincide
Dame & Allen 1996 – organism transport models Invertebrate model 1 River dominated system Lagoonal system Invertebrate model 2
Dame & Allen 1996 – organism transport models Fish model 1 Invertebrate model 3 Invertebrate model 4 Fish model 2
Dame & Allen 1996 – organism transport models Fish model 3 Fish model 4
Darnaude et al. 2004 – trophodynamic linkage model Offshore POM < Terrestrial plant detritus
Darnaude et al. 2004 – trophodynamic linkage model Isotopic differences in C & N among benthic Organisms, suggesting different food sources Surface & subsurface deposit-feeding polychaetes were ND, but both were sign lower than the rest Signatures suggest diet of sediment organic matter Flatfish C diff among species, with common sole having sign lower values than the rest Low N = same trophic level
Darnaude et al. 2004 – trophodynamic linkage model Common sole fed mainly on polychaetes compared to others Sign relationship between wt of ingested polychaetes and fish muscle C values Deposit-feeding polys had lowest C values, fed mainly on terrestrial POM, and were the main diet of common sole
Darnaude et al. 2004 – trophodynamic linkage model Plot of N vs C values by fish, prey and POM sources ND
Varpe et al. 2005 – The ecological importance of herring migration Meta-ecosystems: set of ecosystems connected by spatial flows of energy, materials & orgs across ecosystem boundaries NSS herring is one of the world’s largest fish stocks, with a current spawning stock biomass of ~ 6x10⁶ tonnes or ~ 25x109 inds Loop-like migration: feeding in ocean during summer (Apr-Aug), over-wintering in fjords (Sept-Jan), spawning in coastal banks (Feb-Mar) Adults, eggs and larvae of herring are important food for many coastal species Lobster landings covary with biomass of reproductive output (eggs) left at the coast by herring
Varpe et al. 2005 - Mean body mass increased over summer feeding period for 3 size classes Mean specific consumption rate as mean of all size classes For the mean NSS herring pop (1990-03) annual energy consumption is 1.3 x 10⁷ J This energy would sustain the citizens of London for ~ 6 yrs (7.2 x 10⁶ inds)!!
Varpe et al. 2005 Most of energy consumed during feeding is used, but 17% is used for body mass growth that is transported to the coast where some is used for metabolism & for the spawning migration. However, the rest is for reproduction for next spring It is estimated that herring leave 1.3 x 10⁶ tonnes of eggs & milt at the coastal banks; thus, 7% of energy consumed at sea is used to produce gonads Thus, as pop size varies, so does the transport of energy to the coastal banks Histograms = reproductive output by yr; solid & dashed line = lobster landings So as herring decreased, lobsters did as well
Varpe et al. 2005 NSS herring is important for the transfer of 2nd production to higher trophic levels at sea but because of its migration, food consumed in the sea is transported to higher trophic levels at the coast Consequently, they are vital for both sea and coast food webs NSS herring take about 24x106 tonnes of copepods per yr for medium sizes pops The energy transport from sea to coast varies temporally & with herring pop size At the coast, predators and decomposers are receivers of these resources Because of advanced fishing technology, the herring pop declined & the rapid decline in lobster landings may be due to this reduced food availability, directly or indirectly, by loss Of egg and milt resources