Download
1 / 47
480 likes | 609 Views
Salmon and society: Lessons from the Pacific Northwest. Robin Waples Northwest Fisheries Science Center National Marine Fisheries Service N.O.A.A Seattle, WA USA. Subtext: Tell us how you #@&%ed it up down there so we will feel better [and, perhaps, can avoid the same problems].

E N D
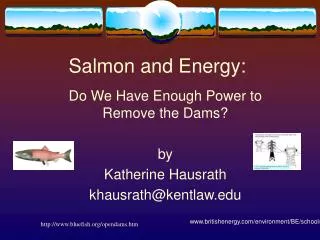
Salmon and society:Lessons from the Pacific Northwest Robin Waples Northwest Fisheries Science Center National Marine Fisheries Service N.O.A.A Seattle, WA USA
Subtext:Tell us how you #@&%ed it updown there so we will feel better [and, perhaps,can avoid the same problems]
Pacific salmon stocks at risk Nehlsen et al. 1991 Number of stocks Special Concern 54 Moderate Extinction Risk 58 High Extinction Risk 101 Extinct <100
Coho salmon landings ocean troll & sport fisheries
Status review scorecard Not Species E T C Listed Chinook 2 7 1 7 Chum - 2 - 2 Coho - 3 2 1 Cutthroat - (1) 1 4 Pink - - - 2 Sockeye 1 1 - 5 Steelhead 2 8 2 3 Totals 5 22 6 24
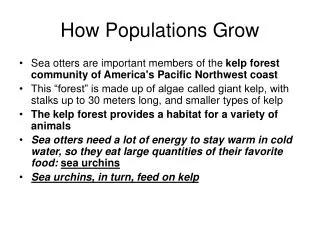
Why is salmon conservation important? Cultural, economic, spiritual reasons Loss of population diversity limits evolutionary potential of the species Life history diversity • Promotes efficient use of natural resources • Buffers productivity Keystone species in terrestrial (and marine) ecosystems
Upstream: National Research Council 1996 General conclusion: “The long-term survival of salmon depends crucially on a diverse and rich store of genetic variation.”
Common counterarguments There are plenty of salmon in Alaska Salmon are colonizing species Salmon have plastic life-history features
Stock transfers of Pacific salmon: "singularly unsuccessful in producing new anadromous stocks” Withler 1982 Stock transfers of O. nerka: Percent successful Kokanee 90 Sockeye <5 Wood 1995
Risk/recovery factors for Pacific salmon • Habitat • Harvest • Hatcheries • Hydropower • Misc (e.g., invasive species; natural variability)
214 Pacific salmon stocks at riskNehlsen et al. 1991 Primary factors for decline: Habitat loss/degradation 92% Overharvest 49% Hatchery interactions 49%
Habitat requirements for Pacific salmon • Ample, high quality water • Aerated spawning gravels • Juvenile rearing areas • Unimpeded migration routes
Skagit River Basin Habitat type Historical habitat Percent change -45% -64% -15% -23% -100% -100% -7% +404% Sloughs Side channel Distributary Tributaries Hydromodified Nonhydromodified Above culverts Above dams Main stem Lakes 860,100 m2 431,200 m2 283,500 m2 463,600 m2 124,200 m2 43,400 m2 632.4 km 735 ha Beechieet al. 1994
40 30 20 10 0 Biotic integrity Coho/Cutthroat Ratio Horner and May 1998 6 4 Biotic Integrity 2 0 10 20 30 40 50 60 Watershed urbanization (%TIA)
Mean number of years between 5-year flood events Pristine 5 Urbanized 1.1 Booth 1991
Human Population Growth in Pierce, King, and Snohomish Counties, 1860-1990
Some dam impacts are obvious
Others only appear to be obvious Snake River spring/summer chinook salmon redds Snake River Dam construction
Ocean conditions (PDO) have shifted Good Poor Hydropower system completed
Other impacts are less clear Snake River spring/summer chinook smolts 1.0 0.8 Williams et al. 2001 from Raymond 1988 0.6 Juvenile Survival in Hydrosystem 0.4 • No data • Fish passage improvements 0.2 0.0 60 62 64 66 68 70 72 74 76 78 80 82 84 86 88 90 92 94 96 98 Outmigration Year
Columbia River Salmon harvest 60 50 1935 Fishwheels prohibited 40 1988 Last sockeye season Salmon landings (millions of pounds) 30 1965 Last Summer season 1977 Last spring season 20 10 1950 Seines, traps, set nets prohibited 0 1990 1870 1880 1890 1900 1910 1920 1930 1940 1950 1960 1970 1980
Replacement MSY Recruits Spawners Spawners
Snake River Steelhead 150,000 Total Natural 100,000 Adult Run Size 50,000 0 1960 1970 1980 1990
Why is it important to conserve wild salmonids--what about hatcheries? Long-term sustainability unproven • Catastrophic failure • Political and funding uncertainties • Erosion of ecological/genetic/life history diversity • Loss of fitness and productivity Hatcheries don’t promote functioning natural ecosystems
Hatchery vs. wild environments Differences Food Substrate Density Temperature Flow regime Competitors Predators Similarities Water
Oregon steelhead 2.00 Local Non-Local Expected 1.60 1.20 From Chilcote 1998 0.80 Productivity 0.40 0.00 -0.40 0 25 50 75 100 25 Percent hatchery
2 1 0 -1 -2 -3 10 20 30 40 50 Average Ocean Productivity Poor Ocean Productivity r2 = 0.06 r2 = 0.73 Survival wild chinook (log) 10 20 30 40 50 Number of hatchery spring chinook released (millions) Levin et al. 2001
Risks Benefits
Types of benefits to be considered Conservation General • Natural pops • Harvest • Mitigation • Treaty obligations • Public education • Natural pops
Supplementation review Waples et al. in press Was it met? Objective Y N ? Broodstock collection (representative) Age 11 3 8 Run timing 10 2 10 Integrity 17 5 - Hatchery survival Prespawning (90%) 12 6 4 Egg-smolt (70%) 19 2 1 Adult-adult (2x) 12 4 6 Population increase (20%) 8 11 3 Natural spawning (comparable) 1 2 19 Sustainable - 2 20
Could indirectly affect salmon by fueling 1o and 2o production in streams A by-product of the life cycle • Most biomass of salmon is acquired at sea • Results in a transfer of marine nutrients to terrestrial systems Directly consumed by cohort of 2000 Adult spawners
Native range Introduced Brook Trout Salvelinus fontinalis
Brook trout absent Brook trout present 0.5 0.4 0.3 Chinook survival 0.2 0.1 0.0 1500 0 500 1000 1500 0 500 1000 Juvenile chinook density Achord et al. 2003
Oregon coast coho Smolt-adult survival (%) Year
Listed ESUs Domain 1) Puget Sound 3 2) Willamette/LCR 5 3) Interior Columbia 7 4) Oregon Coast 1 5) S. Oregon/N. CA 1 6) North-central CA 3 7) South-central CA 2 8) Central Valley 3 Total 25
A B C X X X X X X X X X X Which ESUs are viable?
Risk Diversity High Medium Low • Total 3 5 11 • North 2 3 7 • South 1 2 4 • Summer 2 2 0 • Winter 1 3 11 • Wild 3 3 2 • Hatchery 0 2 9
Conclusions • Causes of salmon declines can be complex • FW habitat most pervasive threat • Habitat problems are caused by people • Habitat that appears pristine may not be • Salmon populations generally are not replaceable on ecological time scales • Long-term effects of hatcheries on natural populations are uncertain but may be profound • In PNW much has been lost, but much remains. Region is at a pivotal point • Fluctuating ocean cycles + declining FW productivity = trouble for salmon