Download
1 / 30
310 likes | 502 Views
System identification of the brake setup in the TU Delft Vehicle Test Lab (VTL ) Jean-Paul Busselaar MSc. thesis. Goals of this final MSc. presentation : Introducing the basics of ABS, tire dynamics and tire friction models related to the Feed Forward ABS controller

E N D
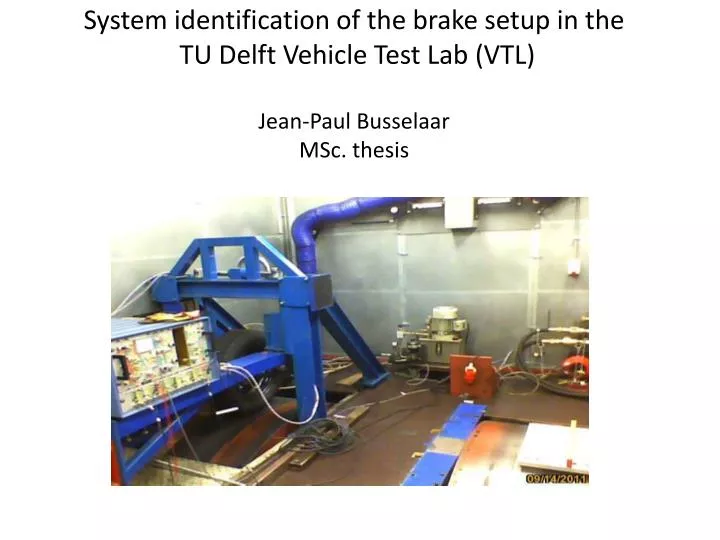
System identification of the brake setup in the TU Delft Vehicle Test Lab (VTL)Jean-Paul Busselaar MSc. thesis
Goals of thisfinal MSc. presentation: Introducing the basics of ABS, tire dynamics and tire friction models related to the Feed Forward ABS controller Introducing the TU Delft VTL Describing the dSPACE data acquisition Presenting the results of the VTL measurement setup Presenting the conclusion
ABS introduction • An Anti-lock Braking System (ABS) is a vehicle motion control system to increase the passive safety of a vehicle. • ABS intends to prevent wheel lock by regulating the hydraulic brake pressure of each wheel to increase the lateral stability.
ABS introduction • ABS consists of mathematic models which are based on physical properties related to tire-road conditions. • Tire friction and road conditions are affecting the control schemes of the mathematic models.
Tire dynamics • The dynamic behaviour of atire is suggested in a coordinate system. • The three forces are: The three moments are: • 1. Longitudinal force Fx 1. Overturning moment Mx • 2. Lateral force Fy2. Rolling moment My • 3. Normal force Fz3. Yawing moment / self-aligning torque Mz
Tire dynamics • Side slip α is the angle between the tire longitudinal axis and the wheel velocity vector • Longitudinal slip is the normalized ratio of the slip velocity and vehicle velocity:
Tire dynamics • A free rolling wheel is represented with . • A locked wheel is indicated by . • ABS controllers are optimized at the transition of the rising and falling slope • Identification of the algorithm for estimating the peak-value can provide a reliable estimation for ABS activation.
Stationary friction models • Static friction is determined by the friction coefficient and the normal force • Coulomb force
Quasi-physical dynamic friction model LuGre Tire friction model • The constant Coulomb friction force is replaced by the speed dependent sliding friction function . • The LuGre model is related to the bristle interpretation of friction. Friction is modeled as the average deflection force of elastic springs.
Feed Forward ABS controller • The Feed Forward ABS controller model is used to do brake pressure dynamics measurements • Quarter car with LuGre tire friction • With • And is the linearized viscous damping • The term with is the non-linearity of the tire-road friction
Feed Forward ABS controller • Flatness-based model inverse • Where is a function of the vehicle speed, acceleration, jerk and the third derivative of the speed
TU Delft Vehicle Test Lab • The TU Delft VTL is used for testing tire behaviour and for prototyping ABS strategies
TU Delft Vehicle Test Lab Tire setup room Control room • Close up brake caliper • Close up test wheel
Brake setup Vehicle Test Lab • The VTL brake system consists of: 1. A hydraulic pump • A by-pass valve to (dis)connect the brake caliper hydraulically • A rubber brake hose in the original situation • A brake caliper with a brake disc, brake pads and forced air cooling • A piezo-electric brake pressure transducer
Brake setup Vehicle Test Lab • A charge amplifier to receive charge form the piezo-electric transducer • An analog proportional controller to measure and adapt the error between the reference and measured brake pressure • A brake torque sensor and receiver
Brake setup Vehicle Test Lab • The situation with design improvement: Stainless Steel braided brake hose
dSPACE • dSPACE is used to control and measure the parameters of the VTL setup. dSPACE contains software as well as hardware components. • Brake pressure measurements are performed with an existing Feed-Forward ABS model in dSPACE. • Modifying the Feed-Forward controller by a signal generator for brake pressure actuation purpose. • Constant average brake pressures with varying amplitudes are used. To achieve this, a constant is added with the signal generator.
dSPACE ControlDesk • To actuate and measure the test setup real-time, a control panel in ControlDesk has to be made. • From the existing Feed-Forward ABS model, the specific parameters has to be carefully chosen. • The control panel contains : • ON-OFF buttons • A constant pressure value slider • graphs with measuring parameters • settings of the actuating signal • data acquisition
Brake pressure dynamicsresults • Sinus wave excitation measurements are executed to show possible differences in brake pressure dynamics. • These are relativelysimple and quick measurements to see the effects between frequencies, amplitudes and constant average in the originalsituation. • Twolast waves are taken to compare for the repeatabilityresult • About 3bar difference between the desired and the actual max pressure • 0,07bar max difference in one97bar case between nr77 and nr78 • 0,08% max difference in 60bar case between nr77 and nr78
Brake pressure dynamicsresults • When the frequency increases with relative low amplitudes: little pressure difference is observed
Brake pressure dynamicsresults • When the amplitude increases 2x, the max pressure dynamics decreases
Brake pressure dynamicsresults • Further increase of the frequency with relative high amplitudes results into larger decrease in pressure dynamics
Brake pressure dynamicsresults • With design improvements stainless steel braided brake hose • Shows an improved repeatability • 0,75bar improved compared to the original situation
Brake pressure dynamicsresults • Random noise excitations to determine transfer functions • Best result of the original settings, cross over frequency 150Hz • Resonance frequency of approx. 84Hz • Bandwidth of approx. 118Hz • Time delay to approx. 250Hz
Brake pressure dynamicsresults • Cross over frequency from 150Hz to 300Hz • Resonance frequency approx. 84Hz • Bandwidth approx. 116Hz when using relative low amplitudes • Time delay to approx. 400Hz
Brake pressure dynamicsresults • Amplitude 1bar • Resonance frequency of approx. 75Hz • Bandwidth of approx. 120Hz • Time delay to approx. 300Hz
Brake pressure dynamicsresults • Check channel 5 input signal with channel 6 with limited freq. content • Resonance frequency of approx. 33Hz • Bandwidth of approx. 115Hz • Time delay to approx. 300Hz
Brake pressure dynamicsresults • Best overall results when changing gains • Resonance frequency of approx. 90Hz • Bandwidth of approx. 112Hz • Time delay to approx. 500Hz
Brake pressure dynamicsresults • Best bandwidth result when changing gains • Resonance frequency of approx. 50Hz • Bandwidth of approx. 117Hz • Time delay to approx. 300Hz
Conclusion • Sinus wave excitation results of the original situation show clearly decreased brake pressure dynamics when increasing the frequency. • Also relative small maximum pressure increase of 0,75bar for the stainless steel braided brake hose situation is observed. When applying relative high amplitudes of 20bar with a constant average 80bar @ 1Hz. • Decreasing the varying amplitude will improve the dynamical behaviour of the measurement setup. • Random noise excitation results with design improvements when increasing the cross over frequency to 300Hz the overall results are slightly decreased. • When changing the proportional gains, little difference in bandwidth is noticed in most cases. • Channel 6 with a limited frequency content has a comparable bandwidth, overall results of channel 5 show a better performance. • The upper knob gain setting of 2.00 shows the best overall results. • The upper knob gain setting of 5.00 shows the best bandwidth of 117Hz. • A cross over frequency of 150Hz and relative low varying amplitudes to 1bar show the best results of all measurements