Download
1 / 14
140 likes | 253 Views
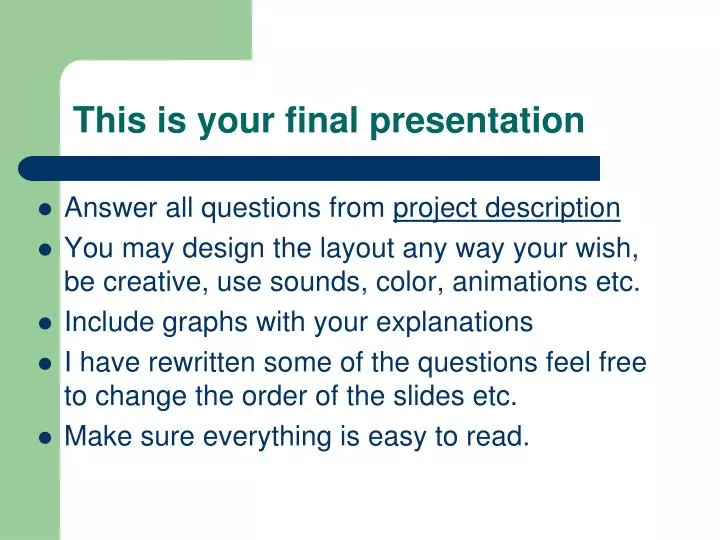
This is your final presentation . Answer all questions from project description You may design the layout any way your wish, be creative, use sounds, color, animations etc. Include graphs with your explanations

E N D
This is your final presentation • Answer all questions from project description • You may design the layout any way your wish, be creative, use sounds, color, animations etc. • Include graphs with your explanations • I have rewritten some of the questions feel free to change the order of the slides etc. • Make sure everything is easy to read.
YOUR THEORY • Develop your own theory on grade correlation. You must compare hw to your final average but you have the choice of comparing hw to another category of your choice. Develop a theory on the relationship between the two. Design and display your data on each: in a table, in a graph or another representation you see fit and state and prove your theory. Make sure you clearly state your theory, which factors are the cause and which factors are the affect and what outside factors need to be mentioned. • I will be grading you on the relationships you make between questions and categories and how well you transition between topics.
Possibly put explanation here Possibly put graph here How does homework affect my final average? Explain
Delete this in the future… Commercial Break 2 How does their homework grade affect all other grades? Explain.
Partner Comparison 1 • What do you notice about your hw data and graphs and that of a fellow classmate. Please include the classmates name and a description of their data etc. Are you similar or different from them and why?
What are the possible reasons for a large change in their grade?What are some of their goals after review their data?
CENTRAL TENDENCY • Which measure of central tendency makes you look the best? (Look at your mean grade, median grade and mode overall) • Display all your grades in order from least to greatest. Using the easiest method possible show the 4 quartiles in your grades and using some sort of key for hw, cw, test, quiz, participation show us AND explain, the quartile in which most of your hw grades lie, cw grades, test grades, quiz grades and your participation grade. Be creative, there may be an easier way to display all the grades without using labels like cw and hw etc. Make it easy to read and pleasing to the eye. (copy your data from excel then sort it, do not mess with you nicely laid out data, make another spot for it)
Create a slide for each graph • You will need to insert new slides depending on how many graphs fit on one page • Show the graphs of each category. Copy them from your excel work. • Show the graph for hw, cw & wr, test, quiz • Create a graph of all the data and make a comparison between categories and your final average. • Explain the type of graph you used and why. Include a reason for why you DID NOT CHOOSE another type of graph. Be specific. For example, I chose a line graph and not a bar graph because….etc. • Add one piece of information you think is valid about each category.
Partner Comparison 2 • Using a different classmate. What is one thing during this project that your classmate helped you with. Please state the problem and how they helped.
Partner Comparison 3 • Would you be offended if we compared your grades to the class? • How do you think this comparison would affect you? • If we were to compare your grades and measures or central tendency etc. to the others in the class or another class, how should we do it. What would be the easiest and most accurate way to do so?
Final Thesis • WHAT CAN YOU, THE STUDENT, DO TO IMPROVE YOUR GRADE? • WHAT CAN I THE TEACHER DO TO IMPROVE YOUR GRADE?
Finished • Hand in your work and go here to have some fun. • http://www.coolmath-games.com/