Download
1 / 42
420 likes | 545 Views
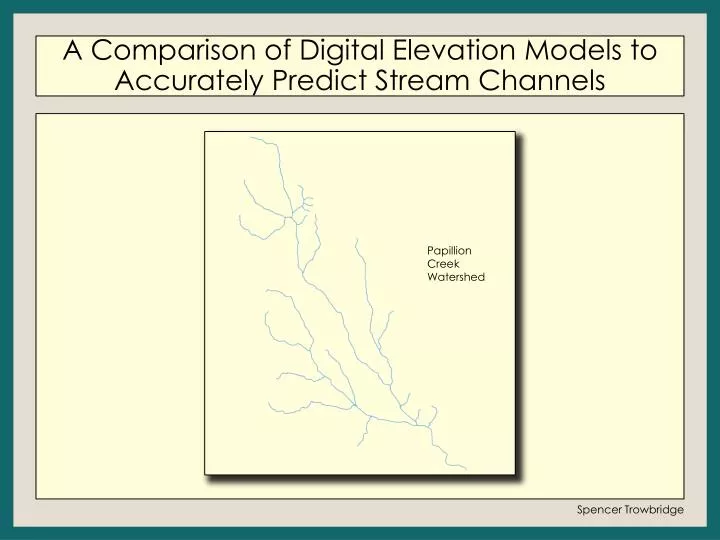
A Comparison of Digital Elevation Models to Accurately Predict Stream Channels. Papillion Creek Watershed. Spencer Trowbridge. Presentation Outline. Research Objectives Methodology Results Summary.

E N D
A Comparison of Digital Elevation Models to Accurately Predict Stream Channels Papillion Creek Watershed Spencer Trowbridge
Presentation Outline • Research Objectives • Methodology • Results • Summary
Research Objective: Determine the resolution of a digital elevation model that best predicts stream channel locations Hypothesis: A finer resolution DEM does not affect its ability to accurately predict a stream channel’s location
Significance of Research Offers a new way to evaluate a DEM’s ability to extract stream channels LiDAR Dataset has not been evaluated for this application
Determination of Error Distance of derived streams to traced banks was classified as error
National Elevation Dataset (NED) National Elevation Dataset (NED) Based on USGS topographic maps Continually updated with most recent and accurate methods available – April 2014 using LiDAR data
Shuttle Radar Topography Mission (SRTM) Shuttle Radar Topography Mission (SRTM) Worldwide coverage from 2000 A variety of resolutions available (90 meters for this study)
Light Detection and Ranging (LiDAR) Data supplied as raw LAS files High precision elevation data captured and stored as point Flown in 2010 – Same time as aerial photographs used for tracing stream channels
Study Area • Hilly topography • Urbanized areas with channelized streams
Named Streams Big Papillion Creek South Papillion Creek West Papillion Creek Little Papillion Creek Papillion Creek Thomas Creek Cole Creek Northwest Branch Walnut Creek Southwest Branch Richter Branch North Branch Mud Creek Leach Branch Hell Creek Falls Branch East Fork Copper Creek Butter Flat Creek Boxelder Creek Boston Branch Big Elk Creek
Methodology • Data Gathering • SRTM, NED, NHD, LiDAR, Orthophotographs • LiDAR DEM Creation • Stream Extraction • ArcGIS Hydrology tools: • Fill • Flow Direction • Flow Accumulation • Stream to Feature • Stream Tracing • Digital Shoreline Analysis System (DSAS) • Baseline Drawing, Transect Casting
Raster Data SRTM DEM NED DEM 1:800,000 Clipped Data Mosaic of two rasters 1:800,000
Raster Data Resolution Differences SRTM 90 meters per pixel NED 30 meters per pixel 1:25,000 1:25,000 Channels clearly visible
Stream Locations SRTM 90 meters per pixel NED 30 meters per pixel Little Papillion Creek Little Papillion Creek Big Papillion Creek Big Papillion Creek 1:25,000 1:25,000 1:25,000
Visual Comparison of Stream Locations Little Papillion Creek Big Papillion Creek 1:25,000
LiDAR DEM Creation • Suggested workflow for raster creation from LiDAR data according to ESRI help pages. http://resources.arcgis.com • 1. Create LAS Dataset to hold the data • 2. Point File • 3. LAS to Multipoint • 4. Create Terrain • 5. Terrain to Raster
LiDAR Point File Tool Determination of average point spacing - Should be available in the metadata of the LAS files. If missing, run Point File tool Result: 4.34 meters LiDAR DEM 4.34 meter cell size 1:50,000 LAS to Multipoint tool asks for average point spacing
LAS to Multipoint Creates large feature class with elevation point data
Create Terrain Tool • Creates triangulated surface from points from LAS to Multipoint 1:1,000 1:15,000
Terrain to Raster Final LiDAR Raster SRTM 90 meters NED 30 meters 4.34 meter cell size 1:22,000
Stream Extraction • ArcGIS hydrology tools used Stream to Feature Fill Flow Direction Flow Accumulation Raster Calculator Creates vectors connecting cells from the flow accumulation tool
Stream to Feature LiDAR Stream to Feature after Raster Calculator tool 1:12,000 Lower order streams eventually edited out manually 1:300,000
NHD Vector Data NHD stream vectors downloaded and used as verification Papillion Creek Watershedafter removal of unneeded streams 1:365,000 1:250,000
SRTM DEM 1:40,000 1:250,00
NED DEM 1:40,000
LiDAR DEM 1:40,000
All Streams All Streams LiDAR NED SRTM NHD 1:300,000 1:40,000
DSAS • ArcGIS extension for collecting shoreline distance measurements • Manually drawn baselines • Casting transects • Raw data collection • Quality control
Manually Drawn Baselines Baselines follow the general direction of the stream channel
Casting Transects Transects cast orthogonally from the baseline Extend far enough to Intersect all extracted streams
Stream Tracing Once transects are cast, one knows where they will intersect with the traced stream banks Stream and transect intersection point
Stream Tracing Traced streams edited where they intersect transects Generalized Stream Tracing Precise Stream Tracing at transect crossing Transect Stream Bank
Raw Data Collection Using the appropriate streams as input, DSAS automatically calculates intersection distances
Results Error Distance Calculations Correct Stream Placement Determination Distribution Analysis of Datasets: Normality for ANOVA ANOVA Student-Newman-Keuls Test Results
Determination of Error Distance of derived streams to traced banks was classified as error. These values were manually calculated within a spreadsheet and used for analysis.
Determination if Streams Predicted Accurately Within a spreadsheet, samples determined if predicted accurately (within the traced stream) If a sample was found to be within the traced banks, a distance value of zero was assigned
Box-Cox Transformation NED LiDAR NHD SRTM Bimodal Distribution Normal Distributions
Summary • Resolution of DEMs affects their ability to delineate stream channels • The finest resolution DEM is not the best at delineating stream channels
Conclusions • A method was created to evaluate a DEM • LiDAR data can be processed (and manipulated) in a variety of ways • It may not be necessary to have high resolution LiDAR data depending on the application • LiDAR is not meant for huge areas such as this watershed
Questions All Streams LiDAR NED SRTM NHD 1:300,000 1:40,000