Download

1 / 28
300 likes | 440 Views
Statistical Analysis of Elevation Variances of Cells of Physiographic Features Extracted from Digital Elevation Models: A Multiscale Approach. Digital Elevation Models (DEMs). The Global Digital Elevation Model (GTOPO30) of Great Basin.

E N D
Statistical Analysis of Elevation Variances of Cells of Physiographic Features Extracted from Digital Elevation Models: A Multiscale Approach
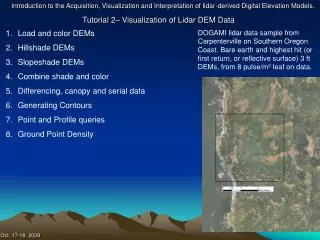
Digital Elevation Models (DEMs) The Global Digital Elevation Model (GTOPO30) of Great Basin • Location: latitude 38 15’ to 42 N, longitude 118 30’ to 115 30’ W • Grid size: 925 m • Elevation range: 1,005 – 3,651 m (rescaled to the interval of 0 to 255 - the brightest pixel has the highest elevation)
Digital Elevation Models (DEMs) • One of the primaries issues in dealing with DEMs are uncertainties caused by: • Data errors: • Data capture errors: • Cloud or forest cover • Instable remote sensing equipment • Atmospheric refraction • Analysis and visualization errors: • Interpolation procedures • The limited horizontal and vertical resolution of terrain models • Scale • Spatial resolution • Spatial extent • Lack of standardization • These factors lead to uncertainties in the extracted landforms and features
Generation of MultiscaleDEMs Multiscale DEMs generated using the lifting scheme, using scales of 1 to 20 Scale: 1 Scale: 3 Scale: 5 Scale: 10 Scale: 15 Scale: 20
Generation of MultiscaleDEMs Multiscale DEMs generated using the lifting scheme, using scales of 1 to 20 Scale: 3 Scale: 1 Scale: 5 Scale: 20 Scale: 15 Scale: 10
Mountains Extracted from the Generated MultiscaleDEMs Scale: 1 Scale: 3 Scale: 5 Scale: 10 Scale: 15 Scale: 20
Physiographic Features Extracted from of the DEM • Segmentation of the terrain of the DEM of Great Basin into the predominant physiographic features; mountains, basins and piedmont slopes
Physiographic Features Extracted from of the DEM Mountains Basins Piedmont slopes
Physiographic Features Extracted from the Generated Multiscale DEMs Basins Scale: 5 Scale: 3 Scale: 1 Scale: 20 Scale: 15 Scale: 10
Physiographic Features Extracted from the Generated Multiscale DEMs Piedmont slopes Scale: 5 Scale: 3 Scale: 1 Scale: 20 Scale: 15 Scale: 10
Multiscale Analysis • A number of studies have been conducted on classification of various landforms extracted from multiscale DEMs, including: • Physiographic features (mountain, basin & piedmont slope) • Morphometric features (plane, channel, ridge, pass, peak & pit) • Hydrological features (drainage networks & catchments) • Beach landforms (foreshors, beach & foredune) • Soil properties (anthrosols, flovisols, cambisols & podzols) • However, not much attention has been provided on the effect of multiscaling on elevation variances.
Objective • To conduct the statistical analysis of elevation variances of cells of physiographic features extracted from multiscaleDEMs. • The statistical parameters analysed are: • Measures of centrality and variability: mean & standard deviation • Measures of distribution shape: skewness & kurtosis • Measures of complexity: energy & entropy
Statistical Parameters Analysed • The most common method to extract statistical parameters of an image is by employing the first order distribution P(b) of the intensities of the image. • DEMs are greyscale images with the intensity of each cell representing elevation at the corresponding location. • For each elevation b in the elevation range (bmin to bmax) of a region with area of M cells, P(b) is computed as follows: • where N(b) is the number of cells with elevation b.
Statistical Parameters Analysed • Measures of Centrality and Variability • Mean SM provides the numerical average of the set of elevation values of the DEM, and indicates where the distribution of the elevations is centred. • Standard deviation SD: • Indicates the variability of the distribution from the mean. • It is often used as a measure of surface roughness, quantifying the vertical deviations of the surface from its best-fit plane, represented by the mean
Statistical Parameters Analysed • Measures of Distribution Shape • SkewnessSS: • Characterises the degree of asymmetry of the elevation distribution around the mean. • A distribution that is symmetric about the mean has skewness of 0. • Values greater than 0 indicate skewness of distributions to the right of the mean, while values less than 0 indicate skewness to the left.
Statistical Parameters Analysed • Measures of Distribution Shape • Kurtosis SK: • A measure the relative peakedness of a distribution relative to the normal distribution. • The kurtosis of a normal distribution is 0. • Distributions that are more outlier-prone than the normal distribution have kurtosis greater than 0, while lower outlier-prone distributions have kurtosis less than 0.
Statistical Parameters Analysed • Measures of Complexity • Energy SN: • Provides a measure of repeated transitions in the distributions. • Energy is a measure of surface roughness, with a higher value indicating a higher rate of repeated transitions and hence, decreased surface roughness, and vice versa.
Statistical Parameters Analysed • Measures of Complexity • Entropy SE: • Is a measure of randomness that can be used to characterise the elevation variation of a DEM. • It provides a low value when the elevations have similar values, and a high value when the elevations vary significantly. • Entropy is also often used as a measure of surface roughness
Results & Analysis • For the respective DEMs and physiographic features, varying patterns are observed in the plots due to varying surface profiles, and the changes that occur over the scales. • For all the parameters, with the exception of mean elevation, the DEMs and mountains exhibit similar patterns at the initial scales, indicating that mountains are the more dominant of the three predominant physiographic features in deciphering terrain character. Standard deviation Skewness Mean Kurtosis Energy Entropy
Results & Analysis • Mean: • Mountains have the highest mean elevations as compared to the other features over the scales. • The mean elevations for the DEMs and mountains decrease with increasing scale due to the removal of fine detail. • However, for basins, the mean elevations increase over scale, as the removal of fine detail causes the removal of concave regions, resulting in increased elevations in the basin regions. • The mean elevations of the piedmont slopes increase at the initial scales due to the removal of concave regions, but then decrease drastically due to the removal of fine detail in these regions.
Results & Analysis • Surface roughness: • Standard deviation, energy and entropy are measures of surface roughness. • It is expected that increase in scale will result in decreased surface roughness for the DEMs and physiographic features due to the removal of curvature regions, and hence, reduced vertical deviations from the best-fit plane Standard deviation Energy Entropy
Results & Analysis • Entropy: • Decreasing values over scale • The DEMs and mountains have higher entropy values compared to the basins and piedmont slopes until the final three scales, where the mountains regions have largely been removed
Results & Analysis • Energy: • The energies of the DEMs and physiographic features increase over the scales, indicating increased occurrences of repeated elevation transitions between the cells and hence, reduced surface roughness. • The DEMs and mountains exhibit lower energies, and hence, higher surface roughness, as compared to the basins and piedmont slopes.
Results & Analysis • Standard deviation: • The standard deviations of the DEMs and mountains decrease with increasing scale. • While both show similar values at the initial scales, the standard deviations of the mountains then decrease drastically, having significantly lower values than the basins and piedmont slopes. • Despite the removal of curvature regions, the basins and piedmont slopes have increasing standard deviations at the initial scales, after which the basins have reducing values and the piedmont slopes have fluctuating values. • The accuracy of standard deviation of elevation as a measure of surface roughness has been called into question as it fails to quantitatively discriminate between surfaces of different amplitudes, frequencies and correlations, and is sensitive to abrupt strong variations in elevation
Results & Analysis • Distribution shape: • Values of skewness and kurtosis over the scales indicate that elevation distributions decrease at: • Higher rates as compared to mean elevations for the DEMs and mountains • Lower rates for the piedmont slopes • Similar rates for the basins. Skewness Kurtosis
Conclusion • This study has provided key insights into the statistical behaviour of elevation variances of cells of physiographic features extracted from multiscale DEMs. • For all the parameters, with the exception of mean elevation, the DEMs and mountains exhibit similar patterns at the initial scales, indicating that mountains are the more dominant of the three predominant physiographic features in deciphering terrain character. • Mean elevation: • The loss of fine detail during multiscaling causes the mean elevations of the DEMs and mountains to decrease. • Elevation gain due to removal of concave regions causes the mean elevation of the basins to increase. • The mean elevation of the piedmont slopes initially increases due to the removal of concave regions, but then decreases drastically due to the removal of fine detail.
Conclusion • Surface roughness: • Energy and entropy prove to be effective surface roughness measures, providing decreasing roughness values for the DEMs and physiographic features over the scales. • On the other hand, standard deviation of elevation is found to be an ineffective surface roughness measure as it fails to quantitatively discriminate between surfaces of different amplitudes, frequencies and correlations, and is sensitive to abrupt strong variations in elevation. • Values of skewness and kurtosis over the scales indicate that elevation distributions decrease at higher rates as compared to mean elevations for the DEMs and mountains, lower for the piedmont slopes, and similar for the basins. • Scope for future work: • For the purposes of this study, the analysis was conducted for a mountainous terrain, with rough surface profile. • For future work, the analysis will be extended to terrains of varying profiles and character.