Download
1 / 109
1.09k likes | 1.09k Views
New designs and paradigms for science- based oncology clinical trials. Richard Simon, D.Sc. Chief, Biometric Research Branch National Cancer Institute http://brb.nci.nih.gov rsimon@nih.gov. Prognostic & Predictive Biomarkers in Oncology.

E N D
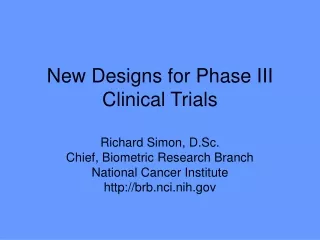
New designs and paradigms for science- based oncology clinical trials Richard Simon, D.Sc. Chief, Biometric Research Branch National Cancer Institute http://brb.nci.nih.gov rsimon@nih.gov
Prognostic & Predictive Biomarkersin Oncology • Many cancer treatments benefit only a minority of patients to whom they are administered • Large NNT • Being able to predict which patients are likely to benefit can • Help patients get effective treatment • Help control medical costs • Improve the success rate of drug development • We now have better tools for understanding variability in outcome and response to rx
Prognostic biomarker or signature • Identify patients with very good or very poor outcome on standard treatment • Predictive biomarker • Identify patients likely or unlikely to respond to a specific treatment
Major problems with prognostic studies of gene expression signatures • Inadequate focus on intended use • Patient selection for study and approach to data analysis are not guided by an intended use • Reporting biased estimates of predictive value
Validation of Prognostic Model • Completely independent validation dataset • Splitting dataset into training and testing sets • Evaluate 1 completely specified model on test set • Complete cross-validation
Leave-one-out Cross Validation for Estimating the Misclassification Rate of Binary Classifier • Full dataset P={1,2,…,n} • Omit case 1 • V1={1}; T1={2,3,…,n} • Develop classifier using training set T1 • Classify cases in V1 and count whether classification is correct or not • Repeat for case 2,3,… • Total number of mis-classified cases
Complete cross Validation • Cross-validation simulates the process of separately developing a model on one set of data and predicting for a test set of data not used in developing the model • All aspects of the model development process must be repeated for each loop of the cross-validation • Feature selection • Tuning parameter optimization
The cross-validated estimate of misclassification error is an estimate of the prediction error for the model fit applying the specified algorithm to the full dataset
Partition data set D into K equal parts D1,D2,...,DK • First training set T1=D-D1 • Develop completely specified prognostic model M1 using only data T1 • eg • Using M1, compute risk group for cases in D1 • Repeat, for new training set T2=D-D2 Develop model M2 using only T2 and then score cases in D2
Repeat for ... T3, …, TK • Calculate Kaplan-Meier survival curve for each risk-group • Calculate time-dependent ROC curve using the cross-validated risk groups and compute AUC
The cross-validated estimate of the survival curves for the risk groups is an estimate of the future performance for the model fit applying the specified algorithm to the full dataset
To evaluate significance, the log-rank test cannot be used for cross-validated Kaplan-Meier curves because the survival times are not independent
Statistical significance can be properly evaluated by approximating the null distribution of the cross-validated log-rank statistic • Permute the survival times and repeat the entire cross-validation procedure to generate new cross-validated K-M curves for low risk and high risk groups • Compute log-rank statistic for the curves • Repeat for many sets of permutations
In many positive phase III clinical trials comparing a new treatment to control, most of the patients treated with the new treatment do not benefit. • Adjuvant breast cancer: 70% long-term disease-free survival on control. 80% disease-free survival on new treatment. 70% of patients don’t need the new treatment. Of the remaining 30%, only 1/3rd benefit.
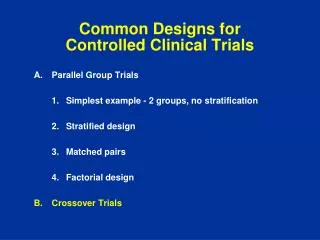
Standard Paradigm of Phase III Clinical Trials • Broad eligibility • Base primary analysis on ITT eligible population • Don’t size for subset analysis, allocate alpha for subset analysis or trust subset analysis • Only do subset analysis if overall treatment effect is significant and interaction is significant
Standard Paradigm Sometimes Leads to • Large NNT • Small average treatment effects • Inconsistent results among studies • False negative studies
Predictive Biomarkers • Cancers of a primary site often represent a heterogeneous group of diverse molecular entities which vary fundamentally with regard to • the oncogenic mutations that cause them • their responsiveness to specific treatments • Molecularly targeted drugs are likely to be effective only for tumors that are driven by de-regulation of the pathway which is a target of the drug
Neither conventional approaches to post-hoc subset analysis nor the broad eligibility paradigm are adequate for genomic based oncology clinical trials
How can we develop new drugs in a manner more consistent with modern disease biology and obtain reliable information about what regimens work for what kinds of patients?
When the Biology is Clear the Development Path is Straightforward • Develop a classifier that identifies the patients likely to benefit from the new drug • Develop an analytically validated test • Measures what it should accurately and reproducibly • Design a focused clinical trial to evaluate effectiveness of the new treatment in test + patients (i.e. those predicted likely to benefit)
Develop Predictor of Benefit from New Drug Using phase II data, develop predictor of response to new drug Patient Predicted Responsive Patient Predicted Non-Responsive Off Study New Drug Control Enrichment design
Successful use of targeted enrichment design • Trastuzumab, pertuzumab, ado-trastuzumab emtansine for HER2 over-expressed or amplified breast cancer • Vemurafinib, dabrafinib, trametinib for BRAF mutated melanoma • Crizotinib and ceritinib in ALK translocated NSCLC • Afatinib in EGFR mutated NSCLC
Advantages of enrichment design • Targets larger treatment effect less diluted by non-sensitive tumors • Avoids exposing patients less likely to benefit to adverse effects of drug until drug is shown effective for those whom it is supposed to benefit • Clarity of interpretation
Regulatory Pathway for Test • Companion diagnostic test with intended use of identifying patients who have disease subtype for which the drug is proven effective
If the drug is effective in test positive patients, it can be later evaluated in test negative patients. • Saves test – patients toxicity until drug is shown effective in the target population it should work in
All comers design • Invites poor design • Too few test + patients • Too many test – patients • Failure to have a specific analysis plan • Invites inappropriate analysis • Inappropriate requirement of not doing subset analysis unless ITT test is significant and interaction is significant
Evaluating the Efficiency of Targeted Design • Simon R and Maitnourim A. Evaluating the efficiency of targeted designs for randomized clinical trials. Clinical Cancer Research 10:6759-63, 2004; Correction and supplement 12:3229, 2006 • Maitnourim A and Simon R. On the efficiency of targeted clinical trials. Statistics in Medicine 24:329-339, 2005.
Two Clinical Trial Designs • Standard design • Randomized comparison of new drug E to control C without the test for screening patients • Enrichment design • Test patients • Randomize only test + patients • Size each design to have power 0.9 and significance level 0.05
RandRat = nuntargeted/ntargeted • TE+=rx effect in marker + stratum • TE-= rx effect in marker – stratum • p+=proportion of patients marker +
RandRat = nuntargeted/ntargeted • If TE-=0 • RandRat = 1/ p+2 • if p+=0.5, RandRat=4
RandRat = nuntargeted/ntargeted • If TE-= TE+/2 • RandRat = 4/(p+ +1)2 • if p+=0.5, RandRat=16/9=1.77
Comparing E vs C on Survival or DFS5% 2-sided Significance and 90% Power
Run-in • Short term (e.g. 4 weeks) • On test treatment or control • Happens before randomization
Run-in “response” used as predictive biomarker, not as surrogate endpoint • Pharmacodynamic measure of treatment effect • Immunologic measure of treatment effect • Short-term quantitative imaging change in tumor size • PSA or quantitative CTC