Download

1 / 15
240 likes | 940 Views
Learn about solving quadratic inequalities using graphs, factorization, and number lines. Discover how to find solutions and graph them for different scenarios.

E N D
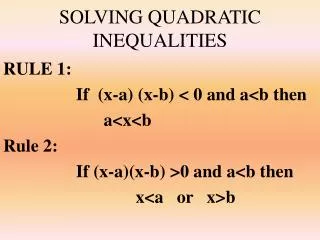
Quadratic inequalities on number lines Quadratic inequalities are inequalities where the highest power of the variable is 2. For example: x2+ x – 6 ≥0 How can this inequality be represented on a number line? The equation x2+ x – 6 =0 needs to be solved first and then the correct regions determined. (x + 3)(x – 2) ≥0 factor: solve: x + 3 = 0 and x – 2 = 0 x = –3 x = 2 These values give the end points of the solution set.
Quadratic inequalities on number lines To find the solution set, test a value from each of the three regions around the known endpoints: Substitute each value into the original inequality x2+ x – 6 ≥0. substitute x = –4: (–4)2 + (–4) – 6 ≥0 6 ≥0 Values in region 1 therefore satisfy the inequality. substitute x = 0: 02 + 0 – 6 ≥0 –6 ≥0 Values in region 2 therefore do not satisfy the inequality.
Quadratic inequalities on number lines substitute x = 3: 32 + 3 – 6 ≥0 6 ≥0 Values in region 3 therefore satisfy the inequality. The completed solution set graphed on a number line looks like this: So the solution to the inequality x2+ x – 6 ≥0 is: x≤ –3 or x≥ 2
Graphing quadratic inequalities A quadratic inequality can be shown on a graph as a region. To graph y≥x2, first draw the graph of y=x2 To graph y≤ x2 + 1, first draw the graph of y=x2 + 1. then shade the region above this curve. then shade the region below this curve. Note: if the inequality symbols are < or >, the curves are drawn as dotted lines.
Solving quadratic inequalities The solution to a quadratic inequality can be found graphically. Solve the inequality x2 < 4 using a graph. Sketch the graph of y = x2. Draw the line y = 4. Find the x-values of the intersections. x2 = 4 equate the functions: take square root: x= 2 or x= –2 The inequality is true for all values of x where the curve is below the line y = 4. Open circles must be used on the graph. Therefore the solution region is: –2 < x < 2
Solving quadratic inequalities Solve the inequality x2+ x – 6 ≥0. Sketch the graph of y = x2+ x – 6 by identifying the roots. (x + 3)(x – 2) =0 factor: The roots are at x = –3 and x = 2. The inequality is true for the region where the graph is greater than 0, i.e. where the curve is above the x-axis. Closed circles must be used on the graph. Therefore the solution region is: x ≤ –3orx ≥ 2
Solving quadratic inequalities Solve the inequality x2 + x– 3 > 4x + 1 graphically. rearrange into the form ax2 + bx + c > 0: x2– 3x– 4 > 0 Sketch the graph of y = x2– 3x– 4 by finding the roots. factor: (x+ 1)(x– 4) = 0 The roots are at x = –1 and x = 4. The inequality is true for the region where the graph is greater than 0. Open circles must be used on the graph. Therefore the solution region is: x < –1orx > 4
Poster area a) Write an expression for the area, A, of this poster: (x – 2)ft b) If the area satisfies the inequality 5 < A < 12, find the range of possible values for x. (x + 2)ft a) area = width × length: A = (x + 2)(x –2) = x2 – 4 b) The range of possible values for x is given by: 5 < x2 – 4 < 12 add 4: 9 < x2 < 16 square root: 3 < x < 4 or –3 > x > –4 The negative solutions imply negative lengths, so disregard these. The solution is therefore 3 < x < 4.
Quadratic inequalities in two variables Graph the inequality y – 1 <x2 + 5. y – 1 < x2 + 5 add 1: y < x2 + 6 Graph the line y < x2 + 6. Shade the correct region. Graph the inequality 2 – x2≥ 6 +x2 – y. 2 – x2≥ 6 +x2 – y add y: y + 2 – x2≥ 6 +x2 add x2: y + 2 ≥ 6 + 2x2 subtract 2: y≥ 4 + 2x2 Graph the line y≥ 2x2 + 4. Shade the correct region.