Download
1 / 23
230 likes | 364 Views
2011 Fire Season Review Canada. Kerry Anderson Canadian Forest Service Edmonton, AB. Canadian FWI System. Methodology. Calculate spring start-up conditions based on fall drought code (DC) values and over-winter precipitation amounts,

E N D
2011 Fire Season ReviewCanada Kerry Anderson Canadian Forest Service Edmonton, AB
Methodology • Calculate spring start-up conditions based on fall drought code (DC) values and over-winter precipitation amounts, • Calculate average daily weather for weather stations across country, • Incorporate Environment Canada’s seasonal predictions, • Determine the fire severity based on the ratio of forecasted over average monthly severity rating (MSR).
Methodology 1. Fall conditions to Spring startup 2. Calculate average daily weather 4. Calculate fire weather anomaly 3. Apply seasonal predictions
Ensemble Forecasts The Canadian Meteorological Centre (CMC) of Environment Canada has been providing temperature and precipitation probabilistic forecasts based on an ensemble of ten integrations of four independent models: climate ver. of the Global Environmental Multiscale model (GEM-CLIM), 2nd gen. of the Atmospheric General Circulation Model (AGCM2), 3rd gen. of the Atmospheric General Circulation Model (AGCM3), Spectral aux éléments finis (SEF). Forecasts are provided for the next four months.
Ensemble Forecasts Predicted temperatures and precipitation amounts are entered into the Canadian FWI system. Temperature Precipitation
Ensemble Forecasts The ensemble approach provides a measure of confidence indicated by the spread of the ensemble members. June
2011 Prediction The 2011 fire season was a relatively normal year with a below-average number of fires and an above-average area burned. 4,327 fires (avg: 7,389) 2,563,290 ha (avg 1,647,438 ha)
2011 Prediction Most of the activity occurred in Alberta (May), and Ontario (July).
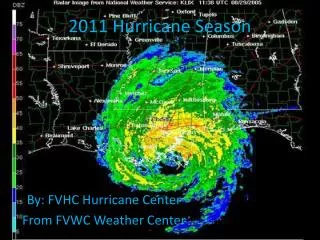
May 2011 On May 15, strong, dry winds gusting up to 70 km/h combined with a lack of precipitation created extreme conditions over most of the northern Alberta. There were 68 new wildfire reported between Saturday and Sunday afternoon of that weekend (May 14-15). These events lead to the Slave Lake and the Richardson Fires.
May 13 –May 16 Slave Lake • Prior to the event, fire danger conditions at Slave Lake weren’t exceptional, but a combination of • high winds ( 50 kmh gusting to 90) • low humidities (as low as 12-13%) • lead to the explosive situation
Richardson Fire Also on May 15, the Richardson fire started north of Ft. McMurray. This fire did an 80 km run in 48 hours. This fire ultimately burned to over 500 000 ha (5 000 km2) in size
July 2011 Ontario saw an extreme fire season in 2011 with the most area burned in over 50 years. In 2011, 1,275 fires burned 633,058 ha. The ten year average is 1,109 fire burning 76,837 ha.
Western Ontario July 20, 2011 Most fires were triggered by lightning events as storms tracked north and south of the province. In July, 650 fires burned 558 000 ha.
March 2011 Prediction April May June We began forecasts on March 1 for the next four months. These forecasts indicate below average conditions in BC and above average in the Quebec and the North.
April 2011 Prediction April May June July The April forecast predicted below-average conditions in Ontario and the western provinces for May, while the country gradually moved to above-average conditions for July. The forecasts for May and June were relatively consistent with the forecasts produced in March.
June June-July August June-July
May 2011 Prediction May June The May forecast predicted above-average conditions for the North and much of Quebec for May to while reducing the July conditions for the mid-latitudes. July August The Richardson fire started on May 14 and burned over 500 000 ha. Northernwestern Saskatchewan and southern NWT saw significant fire activity.
June 2011 Prediction June Contrary to the forecasts, most Canadian provinces saw their fire seasons end in June. The exception being Ontario, which had a fire outbreak in June and July. July August September
July 2011 Prediction The July forecast shows the fire season winding down with Ontario and Quebec having an above-average July.. Fire conditions in general drop in August and September. The forecasts show “above-average” but average conditions are low. July August September
Summary 2011 was a relatively “normal” year with below-average number of fires and an above-average area burned (20% due to a single fire). Model predictions pointed to Northern Alberta as being above-average but failed to detect the situation in western Ontario. (seasonal predictions are aimed at predicting general conditions and not specific weather events). Perhaps in its struggle to find areas of above and below average conditions, the model succeeded in predicting a “normal” fire season.