Download
1 / 32
320 likes | 451 Views
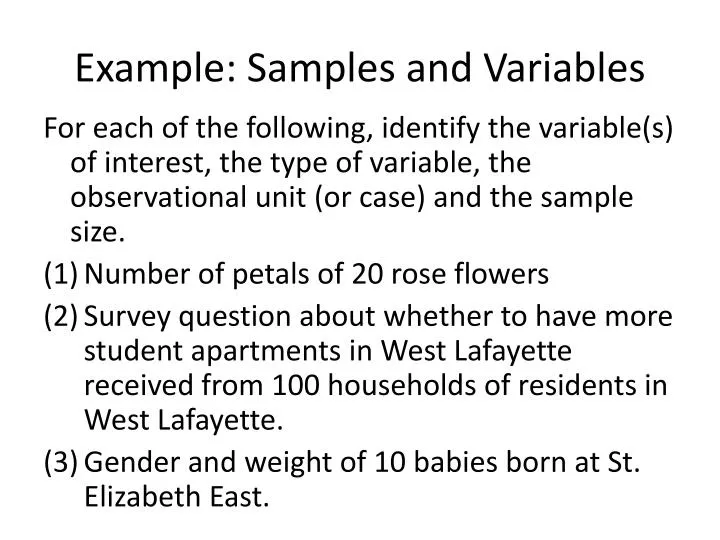
Example: Samples and Variables. For each of the following, identify the variable(s) of interest, the type of variable, the observational unit (or case) and the sample size. Number of petals of 20 rose flowers

E N D
Example: Samples and Variables For each of the following, identify the variable(s) of interest, the type of variable, the observational unit (or case) and the sample size. • Number of petals of 20 rose flowers • Survey question about whether to have more student apartments in West Lafayette received from 100 households of residents in West Lafayette. • Gender and weight of 10 babies born at St. Elizabeth East.
Example 2.2.4: Liter Size of Sows A group of 36 2-year-old sows of the same breed were bred. the number of piglets surviving to 21 days of age were recorded for each sow. What type of variable is this?
Example: Abundance of desert bird species How many species are common in nature and how many are rare? The following frequency distribution is the number of breeding birds of different species in the Organ Pipe Cactus National Monument in southern Arizona. The Analysis of Biological Data, Whitlock, Schluter, 2009, Roberts and Company, pp. 27-29
Example: Abundance of desert bird species Table Histogram
Sources of Error: Serum ALT Alanineaminotransferase (ALT) is an enzyme found in most human tissues. A study was performed to determine the concentration of serum ALT (U/L) in 129 adult volunteers.
Example: Median and Mean Calculate the median and mean for the following: Example 2.3.1/3: Weight Gain of Lambs 11 13 19 2 10 1 Example 1: 2.45 2.57 2.81 2.37 2.01 Example 2: 2.86 2.65 2.75 2.60 2.30 2.49
Example: Median and Mean Calculate the median and mean for the following: Example 2.3.1/2/3: Weight Gain of Lambs 11 13 19 2 10 1 Example 1: 2.45 2.57 2.81 2.37 2.01 Example 1a: 2.45 2.57 2.81 2.37 2.31 Example 2: 2.86 2.65 2.75 2.60 2.30 2.49
Mean vs. Median ỹ ỹ ỹ y̅ y̅ y̅
Example: Menarche As part of a larger study of the effects of strenuous exercise on human fertility and fecundity, the ages (in years) of menarche (the beginning of menstruation) for 10 Olympic female endurance athletes (runners and swimmers) who had vigorously trained for at least 18 months prior to menarche were recorded. What are median, Q1, Q3, IQR?
Example: Menarche (ExHistogramM.sas) mean Q3 Q1 Q3
Example 2.5.1/2: Categorical-Categorical Relationships In an effort to determine if there are difference in primary sources of fecal contamination at different locations in the Morro Bay watershed, n = 623 water specimens were collected at three primary locations that feed into Morro Bay: Chorro Creek (n1 = 241), Los Osos Creek (n2 = 256), and Baywood Seeps (n3 = 126). The type of E. Coli strain was identified as Bird, Domestic Pet, Farm animal, Human, or Terrestrial mammal.
Example 2.5.3: Numeric-Categorical Relationships The effect of different lighting conditions on radish shoot growth.
Example 2.5.4: Numeric-Numeric Relationships The relationship between the concentrations of Selenium in tooth and liver for 10 beluga whales.
Example: Measures of Dispersion Example 1: 2.45 2.57, 2.81 2.37 2.01 Calculate: range, IQR, s, variance, coefficient of variation
Example (ExDispersion.sas) Determine the percentage of data points within 1 SD? 2 SD?
Example: Linear Transformation After taking the temperature of a large number of healthy adults, it has been determined that the average temperature is = 98.6 F with a SD of s = 0.9 F, and variance of s2 = 0.81 F2 • What are the mean, SD and variance in Celsius? • What are the mean, SD and variance of the ‘standardized’ temperature,
Example: Populations Given the following samples, what would possible populations be? 1) fallen cats brought to one veterinary clinic in NYC. 2) 50 children in Vancouver, Canada, suffering from asthma 3) a bar in West Lafayette full of voters 4) fruit flies trapped at a garbage dump