Download
1 / 33
330 likes | 427 Views
Development of a software tool for use in University Physics Laboratories. Doug Harper, Scott Bonham Western Kentucky University. Development of a software tool for use in University Physics Laboratories. Doug Harper, Scott Bonham Western Kentucky University.

E N D
Development of a software tool for use in University Physics Laboratories Doug Harper, Scott Bonham Western Kentucky University
Development of a software tool for use in University Physics Laboratories Doug Harper, Scott Bonham Western Kentucky University
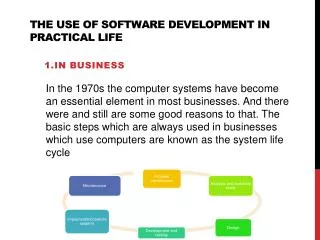
Original curriculum developed in 1998 • NSF Instrumentation and Laboratory Improvement Program: “Transferable-Skills-Based University Physics Laboratories” Doug Humphrey and Doug Harper • Experiments focus on verifying various physics principles and require students to use LabVIEW (National Instruments, www.ni.com) based software tools to acquire data. • Data is often processed in Excel and analyzed in scientific graphing software called Igor Pro (Wavemetrics, www.wavemetrics.com). • Detailed instructions for the experiment are provided to students in their laboratory manual. University Physics Laboratory at WKU
New curriculum developed in 2012 • NSF Course, Curriculum and Laboratory Improvement: “Multidisciplinary Instructional Transformation in Science and Math Courses Supporting Teacher Preparation and Institutional Change” Scott Bonham (PI) • Instructions to students in laboratory manual are more open ended and much less detailed. • Pre-lab exercises are used to provide necessary background information to students prior to lab. • New skills are introduced in a scaffolded manner to students throughout the semester. University Physics Laboratory at WKU
Students completing WKU University Physics I Laboratory should be able to: Demonstrate improved conceptual understanding of foundational physics concepts on a conceptual assessment. Develop experimental proceduresto carry out an investigation to test a hypothesis. Employ good measurement techniques, including calibration of sensors, reading scales, recording units and keeping good records. Collect data, produce standard formatted graphs, and interpret the data. Prepare properly formatted graphs and analyze/interpret them. Be able to identify, minimize and quantify uncertainty in measurements, estimate uncertainties in calculated results, and compare with other results. Carry out appropriate analysis of data using physical models (e.g. equations), including numerical differentiation and integration. Be able to write technical reports as assessed by an appropriate rubric. Effectively function in teams to accomplish different tasks. Students will be able to reproduce a result from a different science team. Report having a positive learning experience in the course. Learning Objectives
We wanted a software tool that would provide a user experience that would not get in the way of learning physics concepts and laboratory skills. Flexible – usable for many different experiment types. Intuitive – easy for students to use. Accurate – for both acquisition and analysis. Efficient – students can acquire and analyze data. Scalable – allows scaffolding of experimental design. Software Design Goals
Experimental Setup Area • Students create and define • waveforms • constants • calculated values • in a custom fashion for different experiments.
Data Acquisition Control Area Data acquisition can be easily started and stopped with the press of a front panel button or a key on the keyboard.
Waveform Data Export Area • Waveform data can be exported to: • MS Word – images of graphs inserted in word document. • Igor Pro – waveform data as Igor text files. • Excel – waveform data in Excel compatible file. • Text – waveform data in tab-delimited form.
Calculations Export Area • Calculations are single values such as a slope, average value, standard deviation, etc. calculated from a subset of a waveform. • Result from multiple runs are tabulated and can be exported to Igor Pro, Excel, or a tab-delimited text file.
Experimental Setup File Area • Definitions of waveforms, constants, and calculated values can be saved to an configuration file so that the experiment can be easily resumed/repeated. • These setup files allow faculty to provide assistance early in the term and the students to have to define everything later in the term.
Tab Controls for Main Display • These tabs change the main display area to show: • Acquired waveforms in a real-time graph. • A data table of all waveform values. • A set of waveform graphs grouped by units. • An x-y graph of one waveform versus another. • A table of calculated values tabulated from repeated runs.
Tabbed interface separates common waveform types • acquired waveforms: sonic ranger, analog input, encoder • derived waveforms • constants • formula waveforms • calculated values Waveforms, Constants, and Calculations
Acquired Waveforms • sonic ranger waveforms: position. • analog input waveforms: force, pressure, temperature (anything that outputs a voltage signal). • encoder waveforms: Pasco rotary motion sensor. • Each acquired waveform channel is associated with • a descriptive name. • a unique variable (used for calculations). • physical channel information. • calibration factors (gain and offset). Waveforms, Constants, and Calculations
Buttons control basic waveform operations • Add waveform • Delete waveform • Move up or down in list • Calibrate waveform • Check waveform • Set timing parameters. Waveforms, Constants, and Calculations
Students calibrate using a wizard that guides them through measuring the sensor output at two widely separated values and then verifying the calibration at an intermediate value. Calibration factors (gain and offset) are stored with the channel information and in the experiment file if the student saves the experimental setup. Calibration: Sonic Ranger
Useful for checking proper operation of sensor. Sensor Check: Sonic Ranger
Timing Parameters Independently control the data collection rate for the • sonic ranger, • analog input, and • encoder waveform channels, along with the total collection time.
Used to compute the derivative, integral, or power spectrum of any previously defined waveform. Derived Waveforms
Students define variable names to be associated with any constant values that will be required in further calculations. Variable names must be unique and cannot collide with previously used variables for the acquired or derived waveforms. Constants
Waveforms can be computed from algebraic formulas involving any previously defined waveforms or constants. • In this example: • Gravitational Potential Energy – depends on position, mass and inclination angle, • Kinetic Energy – depends on mass and velocity, • Total Energy – depends on GPE and KE. Formula Waveforms
During data acquisition all acquired waveforms are updated on the main graph in real time. Acquisition
Waveforms can be inspected in tabular form. Data Table
Waveforms are grouped by their units into separate graphs. Waveform Graphs
Once an region of interest has been identified the student can calculate something specific from that region. Zooming on Area of Interest
The system can calculate single values from any waveform. • Start and stop time based upon the zoom level of the waveform graph. • Items that can be calculated include: • average value • standard deviation • slope • frequency • amplitude Calculated Values
Repeating experiments to obtain multiple results that can be compared becomes very easy. Building Tables from Repeated Trials
Experiments WKU University Physics I Laboratory • Measurement • Position and Velocity • Acceleration • Free Fall • Forces • Friction • Momentum and Impulse • Conservation of Energy • Rotational Motion • Simple Harmonic Motion • Damped Harmonic Motion • Ideal Gas Law • Thermodynamic Cycle
Physics Lab Assistant has proved to bea flexible and powerful yet easy to master software tool for acquiring and analyzing data in our University Physics Laboratories. Students can use the software to design their own experiments by defining what they want to measure and what that wish to calculate from these measurements allowing opportunity for repeated trials under different conditions. We are working toward releasing an open-source version of this software that can be used with your own sensors or sensors purchased from National Instruments. Contact doug.harper@wku.edu for more information. Summary